Distributed Tracing (Tempo)
Distributed tracing solution for Kubernetes cluster is based on Grafana Tempo.
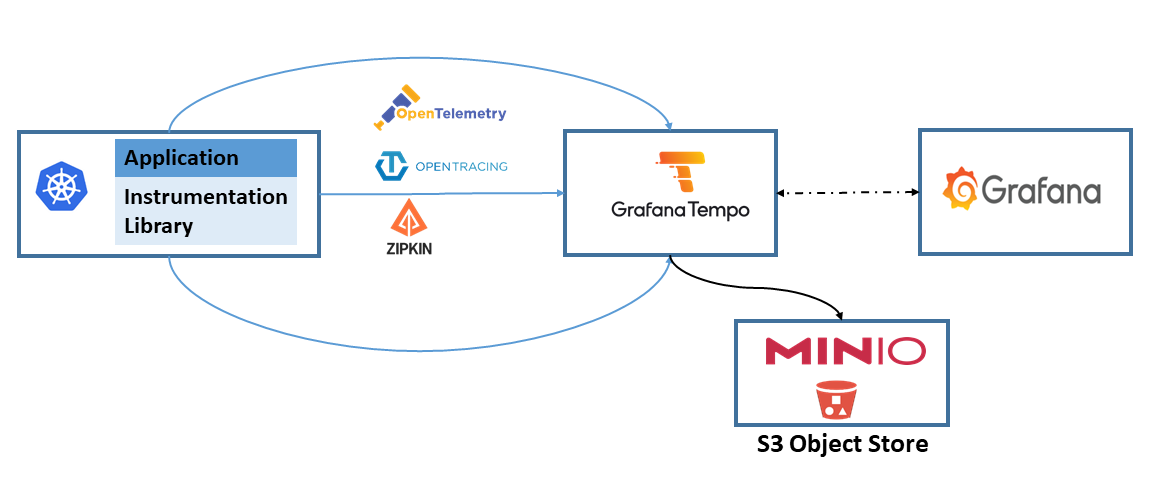
Grafana Tempo is used as traces backend and Grafana as front-end. Tempo, integrates a Open Telemetry collector enabling the ingestion of traces generated with common open source tracing protocols like Jaeger, Zipkin, and OpenTelemetry.
Tempo requires only an object storage backend to operate, and is integrated with Grafana, Prometheus, and Loki. An S3 Object Store will be used as Tempo backend.
Instead of using embedded Tempo’s collector, Pi Cluster uses the same OpenTelemetry Collector deployed in the cluster for receiving and processing telemetry from applications and platform components. That allows to centralize telemetry processing and exporting in a single component, while supporting multiple backends (Prometheus for metrics, Elasticsearch for logs, Tempo for traces) and multiple collection paths (OTLP for instrumented workloads, Prometheus scraping and Fluent Bit collection for non-instrumented workloads).
See details in Observability solution documentation and instructions on how to configure OpenTelemetry Collector for Tempo in OpenTelemetry Collector documentation.
Tempo architecture
Tempo architecture is displayed in the following picture (source: Grafana documentation):
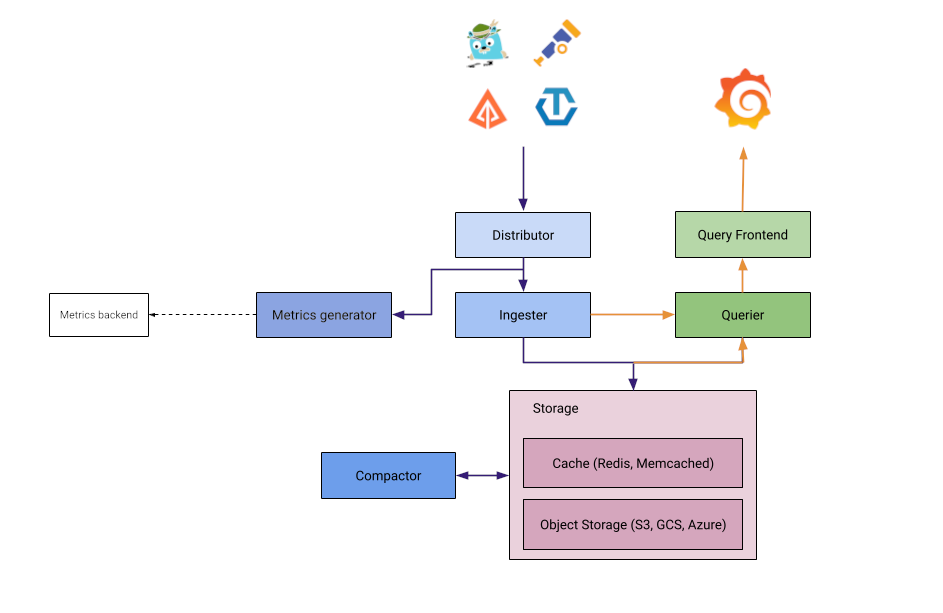
Tempo architecture is quite similar to Loki’s.
- Distributor: responsible for collect traces in different formats (Jaeger, Zipkin, OpenTelemetry)
- Ingester: responsible for batching trace into blocks and storing them in S3 backend
- Query Frontend: responsible for sharding the search space for an incoming query and distributed the sharded query to querier component
- Querier: responsible for finding the requested trace id in either the ingesters or the backend storage
- Compactor: responsible for compacting trace blocks in the backend.
All Tempo components are included within a single binary (docker image) that supports two different deployments modes (helm installation) where the above components can be started in different PODs:
-
Monolithic mode
In this mode, all Tempo components are running in a single process (container).
-
Microservices mode
In microservices mode, components are deployed in distinct processes. Scaling and HA is specified by microservice.
Further details in Tempo architecture documentation: Tempo Architecture and Tempo deployment
Tempo will be installed using microservices mode configuring an S3 Object Storage Server as backend.
Configure S3 Server
The S3 storage server is used as Tempo long-term data storage.
Grafana Tempo needs to store two different types of data: chunks and indexes. Both of them can be stored in an S3-compatible server.
Note:
Tempo helm chart is able to install an S3 service as a subchart, but its installation will be disabled and the S3 Storage Service already deployed in the cluster will be used as Tempo’s backend.
As part of the S3 Storage Service installation, Tempo’s S3 bucket, policy and user is already configured. See documentation: “PiCluster - S3 Backup Backend”.
Create S3 user and bucket
Use RustFS CLI (rc) to create the Tempo bucket and user:
rc mb <s3_alias>/k3s-tempo
rc admin user add <s3_alias> tempo <user_password>
Note:
As the Tempo’s documentation states, when using S3 as object storage, the following permissions are needed:
- s3:ListBucket
- s3:PutObject
- s3:GetObject
- s3:DeleteObject
- s3:GetObjectTagging
- s3:PutObjectTagging
Over the resources: arn:aws:s3:::
Apply policy to user tempo so it has the proper persmissions on k3s-tempo bucket.
  rc admin policy create <s3_alias> tempo user_policy.json
  rc admin policy attach <s3_alias> tempo tempo
Where user_policy.json, contains the following AWS access policies definition:
{
    "Version": "2012-10-17",
    "Statement": [
        {
            "Sid": "TempoPermissions",
            "Effect": "Allow",
            "Action": [
                "s3:PutObject",
                "s3:GetObject",
                "s3:ListBucket",
                "s3:DeleteObject",
                "s3:GetObjectTagging",
                "s3:PutObjectTagging"
            ],
            "Resource": [
                "arn:aws:s3:::k3s-tempo/*",
                "arn:aws:s3:::k3s-tempo"
            ]
        }
    ]
}
Tempo Installation
- Step 1: Add the Grafana repository:
helm repo add grafana https://grafana.github.io/helm-charts - Step2: Fetch the latest charts from the repository:
helm repo update - Step 3: Create namespace
kubectl create namespace tempo -
Step 4: Create file
tempo-values.ymlstreamOverHTTPEnabled: true # Enable trace ingestion traces: otlp: grpc: enabled: true http: enabled: true zipkin: enabled: true jaeger: thriftCompact: enabled: true thriftHttp: enabled: true opencensus: enabled: true # Configure S3 backend storage: trace: backend: s3 s3: bucket: k3s-tempo endpoint: <s3_endpoint> region: eu-west-1 access_key: <s3_tempo_user> secret_key: <s3_tempo_key> insecure: false # Configure distributor distributor: config: log_received_spans: enabled: true # Enable metrics-generator so TraceQL metrics queries such as rate() work metricsGenerator: enabled: true config: processor: local_blocks: filter_server_spans: false flush_to_storage: true # Disable built-in S3 server subchart minio: enabled: falseThis configuration:
-
Enable S3 as storage backend, providing S3 credentials and bucket.
-
Enable traces ingestion of different protocols.
-
Enable Tempo search streaming for Grafana (
streamOverHTTPEnabled: true). -
Enable the metrics-generator so TraceQL metrics queries can use a live ring.
-
Disable minio server installation (
minio.enabled)
-
- Step 3: Install Tempo in
temponamespacehelm install tempo grafana/tempo-distributed -f tempo-values.yml --namespace tempo - Step 4: Check status of Loki pods
kubectl get pods -l app.kubernetes.io/name=tempo -n tempo
GitOps installation
As an alternative, for GitOps deployments, instead of hardcoding S3 credentials within Helm chart values, a external secret can be configured leveraging Tempo’s capability of using environment variables in config file.
The following secret need to be created:
apiVersion: v1
kind: Secret
metadata:
  name: tempo-s3-secret
  namespace: tempo
type: Opaque
data:
  S3_ACCESS_KEY_ID: < minio_tempo_user | b64encode >
  S3_SECRET_ACCESS_KEY: < minio_tempo_key | b64encode >
And the following Helm values has to be provided:
streamOverHTTPEnabled: true

# Enable trace ingestion
traces:
  otlp:
    grpc:
      enabled: true
    http:
      enabled: true
  zipkin:
    enabled: true
  jaeger:
    thriftCompact:
      enabled: true
    thriftHttp:
      enabled: true
  opencensus:
    enabled: true

# Configure S3 backend
storage:
  trace:
    backend: s3
    s3:
      bucket: k3s-tempo
      endpoint: "${S3_SERVER}:9091"
      region: eu-west-1
      access_key: ${S3_ACCESS_KEY_ID}
      secret_key: ${S3_SECRET_ACCESS_KEY}
      insecure: false

# Configure distributor
distributor:
  config:
    log_received_spans:
      enabled: true
  # Enable environment variables in config file
  # https://grafana.com/docs/tempo/latest/configuration/#use-environment-variables-in-the-configuration
  extraArgs:
    - '-config.expand-env=true'
  extraEnv:
    - name: S3_ACCESS_KEY_ID
      valueFrom:
        secretKeyRef:
          name: tempo-s3-secret
          key: S3_ACCESS_KEY_ID
    - name: S3_SECRET_ACCESS_KEY
      valueFrom:
        secretKeyRef:
          name: tempo-s3-secret
          key: S3_SECRET_ACCESS_KEY
# Configure ingester
ingester:
  # Enable environment variables in config file
  # https://grafana.com/docs/tempo/latest/configuration/#use-environment-variables-in-the-configuration
  extraArgs:
    - '-config.expand-env=true'
  extraEnv:
    - name: S3_ACCESS_KEY_ID
      valueFrom:
        secretKeyRef:
          name: tempo-s3-secret
          key: S3_ACCESS_KEY_ID
    - name: S3_SECRET_ACCESS_KEY
      valueFrom:
        secretKeyRef:
          name: tempo-s3-secret
          key: S3_SECRET_ACCESS_KEY
# Configure compactor
compactor:
  # Enable environment variables in config file
  # https://grafana.com/docs/tempo/latest/configuration/#use-environment-variables-in-the-configuration
  extraArgs:
    - '-config.expand-env=true'
  extraEnv:
    - name: S3_ACCESS_KEY_ID
      valueFrom:
        secretKeyRef:
          name: tempo-s3-secret
          key: S3_ACCESS_KEY_ID
    - name: S3_SECRET_ACCESS_KEY
      valueFrom:
        secretKeyRef:
          name: tempo-s3-secret
          key: S3_SECRET_ACCESS_KEY
# Configure querier
querier:
  # Enable environment variables in config file
  # https://grafana.com/docs/tempo/latest/configuration/#use-environment-variables-in-the-configuration
  extraArgs:
    - '-config.expand-env=true'
  extraEnv:
    - name: S3_ACCESS_KEY_ID
      valueFrom:
        secretKeyRef:
          name: tempo-s3-secret
          key: S3_ACCESS_KEY_ID
    - name: S3_SECRET_ACCESS_KEY
      valueFrom:
        secretKeyRef:
          name: tempo-s3-secret
          key: S3_SECRET_ACCESS_KEY
# Configure query-frontend
queryFrontend:
  # Enable environment variables in config file
  # https://grafana.com/docs/tempo/latest/configuration/#use-environment-variables-in-the-configuration
  extraArgs:
    - '-config.expand-env=true'
  extraEnv:
    - name: S3_ACCESS_KEY_ID
      valueFrom:
        secretKeyRef:
          name: tempo-s3-secret
          key: S3_ACCESS_KEY_ID
    - name: S3_SECRET_ACCESS_KEY
      valueFrom:
        secretKeyRef:
          name: tempo-s3-secret
          key: S3_SECRET_ACCESS_KEY

# Enable metrics-generator so TraceQL metrics queries such as rate() work
metricsGenerator:
  enabled: true
  config:
    processor:
      local_blocks:
        filter_server_spans: false
        flush_to_storage: true
  # Enable environment variables in config file
  # https://grafana.com/docs/tempo/latest/configuration/#use-environment-variables-in-the-configuration
  extraArgs:
    - '-config.expand-env=true'
  extraEnv:
    - name: S3_ACCESS_KEY_ID
      valueFrom:
        secretKeyRef:
          name: tempo-s3-secret
          key: S3_ACCESS_KEY_ID
    - name: S3_SECRET_ACCESS_KEY
      valueFrom:
        secretKeyRef:
          name: tempo-s3-secret
          key: S3_SECRET_ACCESS_KEY

# Disable built-in S3 server subchart
minio:
  enabled: false
As tempo is running in distributed mode, extra arguments for each of the services that will be connecting to S3 storage service has to be configured. This means that we have to apply the configuration to the following services:
- distributor
- compactor
- ingester
- metrics-generator
- querier
- query-frontend
Tempo Configuration
Grafana Configuration
See Grafana Operator - Provisioning Data Sources for the general GrafanaDatasource provisioning pattern used by Grafana Operator.
Tempo need to be added to Grafana as DataSource. In Tempo distributed mode, the endpoint to be used is the query-frontend service.
Tempo search streaming requires the Tempo Helm chart to enable streamOverHTTPEnabled: true, which maps to Tempo’s stream_over_http_enabled: true setting. The full request path between Grafana and Tempo must still preserve HTTP/2 correctly. Otherwise Grafana can emit gRPC preface errors when opening traces from Loki links.
In this repository, the Tempo Helm values should include:
streamOverHTTPEnabled: true
This can be done automatically when installing kube-prometheus-stack providing the following additional helm chart configuration:
grafana:
  # Additional data source
  additionalDataSources:
  - name: Tempo
    type: tempo
    uid: tempo
    access: proxy
    url: http://tempo-query-frontend.tempo.svc.cluster.local:3200
    jsonData:
      streamingEnabled:
        search: true
If Grafana is deployed with Grafana Operator, the same configuration is defined through a GrafanaDatasource resource instead of Helm values:
apiVersion: grafana.integreatly.org/v1beta1
kind: GrafanaDatasource
metadata:
  name: tempo
spec:
  instanceSelector:
    matchLabels:
      dashboards: grafana
  datasource:
    name: Tempo
    uid: tempo
    type: tempo
    access: proxy
    url: http://tempo-query-frontend.tempo.svc.cluster.local:3200
    basicAuth: false
    jsonData:
      streamingEnabled:
        search: true
Loki and Tempo integration
Logs to Traces correlation
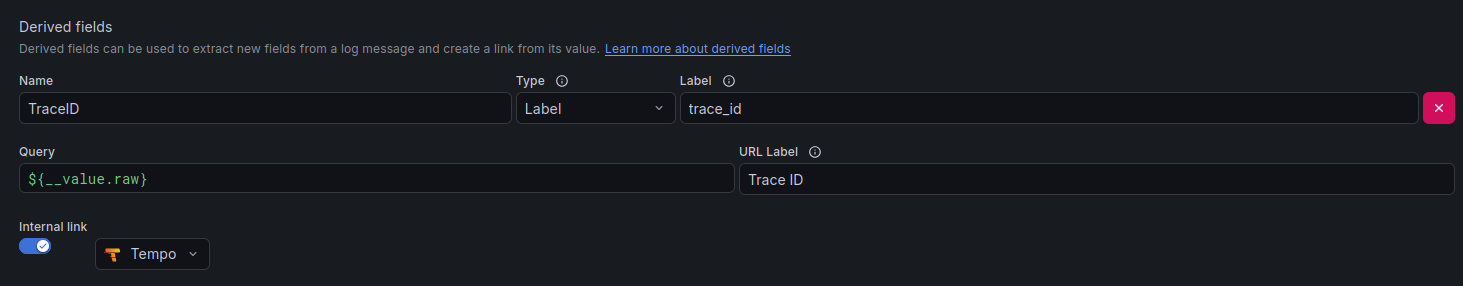
Grafana’s Loki data source can be configured to detect traceID automatically and providing a link in grafana to automatically opening the corresponding trace information from Tempo.
See Loki data source - derived Fields.
Loki Data source configuration needs to be updated to include Tempo as a derived field datasource, and the regex pattern to detect traceID in log messages.
This can be done automatically when installing kube-prometheus-stack providing the following helm chart configuration:
grafana
  additionalDataSources:
  - name: Loki
    type: loki
    uid: loki
    access: proxy
    url: http://loki-read-headless.loki.svc.cluster.local
    jsonData:
      derivedFields:
        - datasourceUid: tempo
          matcherRegex: trace_id
          matcherType: label
          name: TraceID
          url: "$S{__value.raw}"
  - name: Tempo
    uid: tempo
    type: tempo
    access: proxy
    url: http://tempo-query-frontend.tempo.svc.cluster.local:3200
    jsonData:
      streamingEnabled:
        search: true
Note:
$ character need to be escaped as $$ in Grafana datasource configuration. Otherwise, Grafana will try to resolve it as a template variable and the query will not work as expected.
A derived field TraceID is added to logs whose message containing label trace_id. Envoy-Gateway access logs contains this label as part of the log record generated by OpenTelemetry.
When clicking on the TraceID link, Grafana will automatically search for that trace ID in Tempo and display the corresponding trace information.
If Grafana is deployed with Grafana Operator, the Loki and Tempo integration can be configured declaratively with GrafanaDatasource resources:
apiVersion: grafana.integreatly.org/v1beta1
kind: GrafanaDatasource
metadata:
  name: loki
spec:
  instanceSelector:
    matchLabels:
      dashboards: grafana
  datasource:
    name: Loki
    uid: loki
    type: loki
    access: proxy
    url: http://loki-read-headless.loki.svc.cluster.local:3100
    jsonData:
      derivedFields:
        - datasourceUid: tempo
          matcherRegex: trace_id
          matcherType: label
          name: TraceID
          url: $${__value.raw}
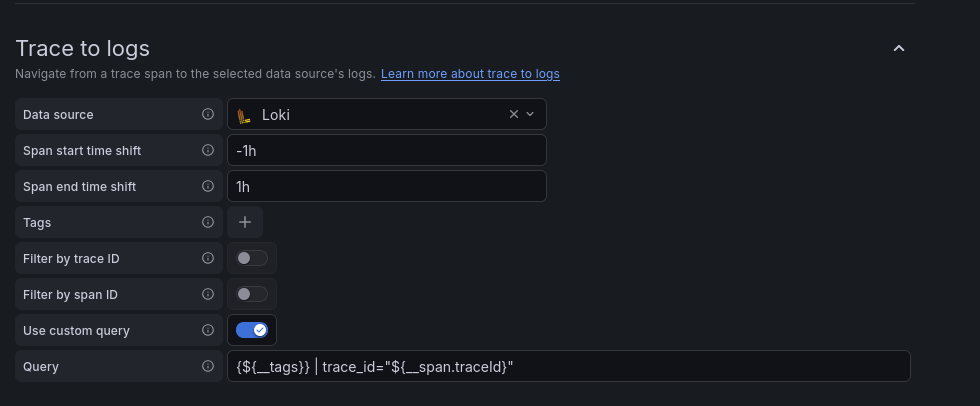
Traces to Logs correlation
Grafana Tempo can be configured to include links to Loki Explore when displaying trace information. This allows users to easily navigate from a trace to the corresponding logs in Loki.
Tempo datasource need to be updated to include the following custom query configuration
This can be done automatically when installing kube-prometheus-stack providing the following helm chart configuration:
grafana:
  additionalDataSources:
  - name: Tempo
    uid: tempo
    type: tempo
    access: proxy
    url: http://tempo-query-frontend.tempo.svc.cluster.local:3200
    jsonData:
      streamingEnabled:
        search: true
      tracesToLogsV2:
        datasourceUid: 'loki'
        spanStartTimeShift: '-1h'
        spanEndTimeShift: '1h'
        filterByTraceID: false
        filterBySpanID: false
        customQuery: true
        query: '{$${__tags}} | trace_id="$${__span.traceId}"'
With Grafana Operator, the same correlation is configured in GrafanaDatasource.spec.datasource.jsonData.tracesToLogsV2, as shown in the combined Loki and Tempo example above.
Grafana Tempo’s tracesToLogsV2 configuration allows to specify a custom query that will be used to search for logs in Loki when clicking on the “Logs” link from a trace. In the above configuration, the query is set to search for logs that have a label trace_id matching the trace ID of the selected span.
Note:
$ character need to be escaped as $$ in Grafana datasource configuration. Otherwise, Grafana will try to resolve it as a template variable and the query will not work as expected.
If Grafana is deployed with Grafana Operator, the Loki and Tempo integration can be configured declaratively with GrafanaDatasource resources:
---
apiVersion: grafana.integreatly.org/v1beta1
kind: GrafanaDatasource
metadata:
  name: tempo
spec:
  instanceSelector:
    matchLabels:
      dashboards: grafana
  datasource:
    name: Tempo
    uid: tempo
    type: tempo
    access: proxy
    url: http://tempo-query-frontend.tempo.svc.cluster.local:3200
    basicAuth: false
    jsonData:
      tracesToLogsV2:
        datasourceUid: loki
        spanStartTimeShift: -1h
        spanEndTimeShift: 1h
        filterByTraceID: false
        filterBySpanID: false
        customQuery: true
        query: '{$${__tags}} | trace_id="$${__span.traceId}"'
      serviceMap:
        datasourceUid: prometheus
      nodeGraph:
        enabled: true
      search:
        hide: false
      traceQuery:
        timeShiftEnabled: true
        spanStartTimeShift: -1h
        spanEndTimeShift: 1h
      spanBar:
        type: Tag
        tag: http.path
      streamingEnabled:
        search: true