Monitoring (Prometheus)
Prometheus stack installation for kubernetes using Prometheus Operator can be streamlined using kube-prometheus project maintained by the community.
That project collects Kubernetes manifests, Grafana dashboards, and Prometheus rules combined with documentation and scripts to provide easy to operate end-to-end Kubernetes cluster monitoring with Prometheus using the Prometheus Operator.
Components included in kube-prom-stack package are:
- Prometheus Operator
- Highly available Prometheus
- Highly available Alertmanager
- prometheus-node-exporter to collect metrics from each cluster node
- kube-state-metrics to collect metrics about the state of kubernetes’ objects.
- Grafana as visualization tool.
This stack is meant for cluster monitoring, so it is pre-configured to collect metrics from all Kubernetes components.
The architecture of components deployed is showed in the following image.
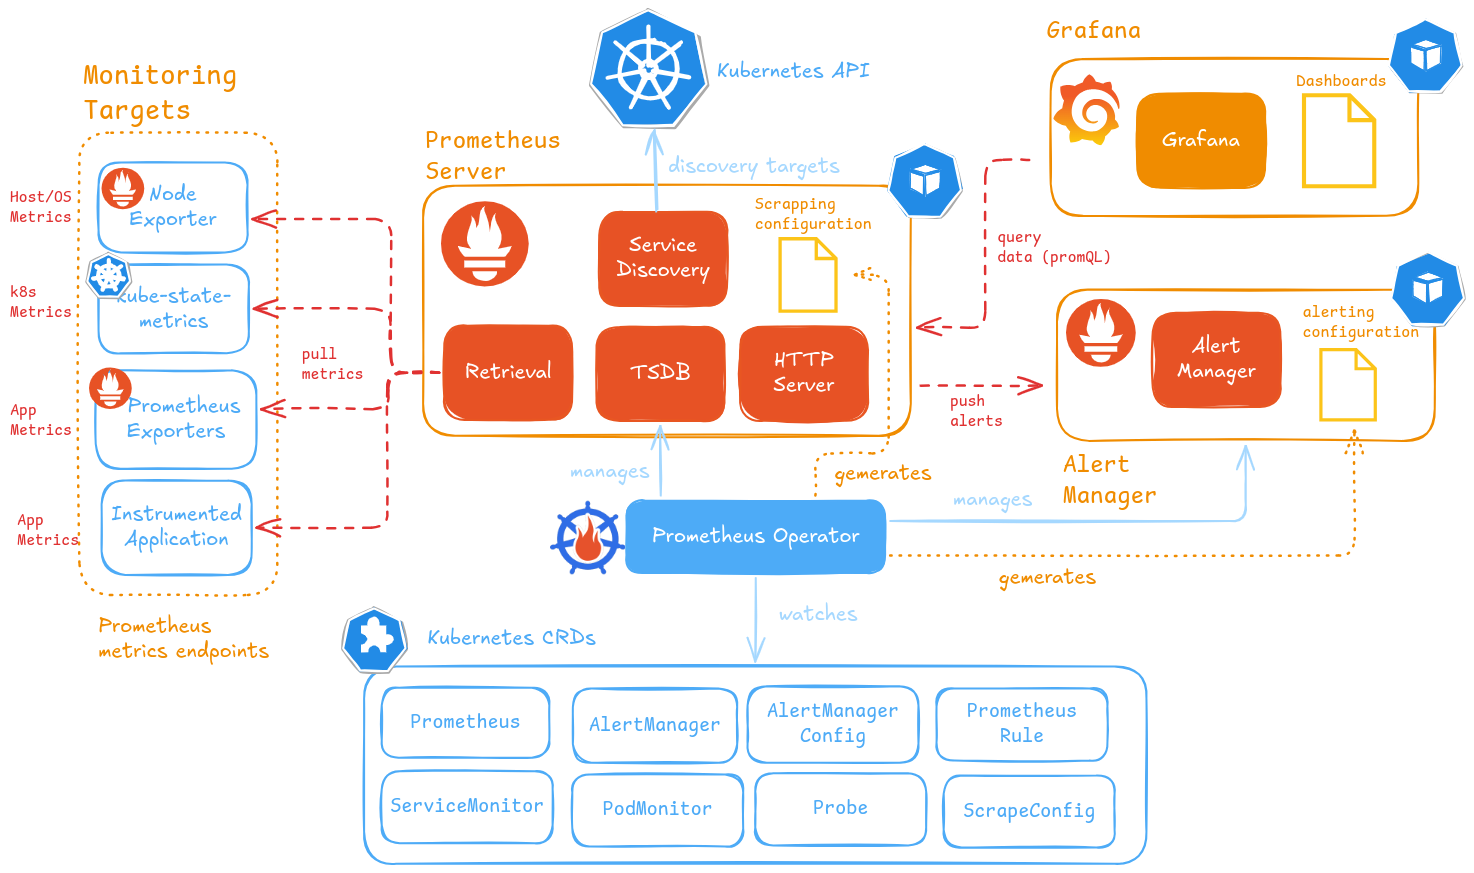
About Prometheus Operator
Prometheus operator manages Prometheus and AlertManager deployments and their configuration through the use of Kubernetes CRD (Custom Resource Definitions):
PrometheusandAlertManagerCRDs: declaratively defines a desired Prometheus/AlertManager setup to run in a Kubernetes cluster. It provides options to configure the number of replicas and persistent storage.ServiceMonitor/PodMonitor/Probe/ScrapeConfigCRDs: manages Prometheus service discovery configuration, defining how a dynamic set of services/pods/static-targets should be monitored.PrometheusRulesCRD: defines Prometheus’ alerting and recording rules. Alerting rules, to define alert conditions to be notified (via AlertManager), and recording rules, allowing Prometheus to precompute frequently needed or computationally expensive expressions and save their result as a new set of time series.AlertManagerConfigCRD defines Alertmanager configuration, allowing routing of alerts to custom receivers, and setting inhibition rules.
Note: New ScrapeConfigCRD
Starting with prometheus-operator v0.65.x, one can use the ScrapeConfig CRD to scrape targets external to the Kubernetes cluster or create scrape configurations that are not possible with the higher level ServiceMonitor/Probe/PodMonitor resources.
See further details in “Prometheus Operator Doc: ScrapeConfig CRD”.
Note:
More details about Prometheus Operator CRDs can be found in Prometheus Operator Design Documentation.
Spec of the different CRDs can be found in Prometheus Operator API reference guide
Kube-Prometheus Stack installation
Installation
Kube-prometheus stack can be installed using helm kube-prometheus-stack maintained by the community
-
Step 1: Add the Prometheus repository
helm repo add prometheus-community https://prometheus-community.github.io/helm-charts -
Step 2: Fetch the latest charts from the repository
helm repo update -
Step 3: Create
kube-prom-stack-values.ymlproviding basic configuration# Produce cleaner resources names cleanPrometheusOperatorObjectNames: true # AlertManager configuration alertmanager: alertmanagerSpec: ## ## Configure access to AlertManager via dedicated hostname externalUrl: https://alertmanager.${CLUSTER_DOMAIN} ## ## HA configuration: Replicas ## Number of Alertmanager POD replicas replicas: 1 ## ## POD Storage Spec storage: volumeClaimTemplate: spec: storageClassName: ${STORAGE_CLASS} accessModes: ["ReadWriteOnce"] resources: requests: storage: 5Gi ## ## Configure HTTPRoute via Gateway API route: main: enabled: true hostnames: - alertmanager.${CLUSTER_DOMAIN} parentRefs: - name: public-gateway namespace: envoy-gateway-system # Prometheus configuration prometheus: prometheusSpec: ## ## Removing default filter Prometheus selectors ## Default selector filters defined by default in helm chart. ## matchLabels: ## release: {{ $.Release.Name | quote }} ## ServiceMonitor, PodMonitor, Probe and Rules need to have label 'release' equals to kube-prom-stack helm release (kube-prom-stack) podMonitorSelectorNilUsesHelmValues: false probeSelectorNilUsesHelmValues: false ruleSelectorNilUsesHelmValues: false scrapeConfigSelectorNilUsesHelmValues: false serviceMonitorSelectorNilUsesHelmValues: false ## ## EnableAdminAPI enables Prometheus the administrative HTTP API which includes functionality such as deleting time series. ## This is disabled by default. --web.enable-admin-api command line ## ref: https://prometheus.io/docs/prometheus/latest/querying/api/#tsdb-admin-apis enableAdminAPI: true ## ## Configure access to Prometheus via dedicated hostname ## --web.external-url Prometheus command line parameter externalUrl: https://prometheus.${CLUSTER_DOMAIN} ## ## HA configuration: Replicas & Shards ## Number of replicas of each shard to deploy for a Prometheus deployment. ## Number of replicas multiplied by shards is the total number of Pods created. replicas: 1 shards: 1 ## ## TSDB Configuration ## ref: https://prometheus.io/docs/prometheus/latest/storage/#operational-aspects # Enable WAL compression walCompression: true # Retention data configuration retention: 14d retentionSize: 50GB ## Enable Experimental Features # ref: https://prometheus.io/docs/prometheus/latest/feature_flags/ enableFeatures: # Enable Memory snapshot on shutdown. - memory-snapshot-on-shutdown ## ## Limit POD Resources resources: requests: cpu: 100m limits: memory: 2000Mi ## ## POD Storage Spec storageSpec: volumeClaimTemplate: spec: storageClassName: ${STORAGE_CLASS} accessModes: ["ReadWriteOnce"] resources: requests: storage: 5Gi # Additional external labels to be added to all metrics externalLabels: cluster: ${CLUSTER_NAME:-pi-cluster} ## ## Configure HTTPRoute via Gateway API route: main: enabled: true hostnames: - prometheus.${CLUSTER_DOMAIN} parentRefs: - name: public-gateway namespace: envoy-gateway-system # Prometheus Node Exporter Configuration prometheus-node-exporter: fullnameOverride: node-exporter # Kube-State-Metrics Configuration kube-state-metrics: fullnameOverride: kube-state-metrics # Grafana Configuration grafana: fullnameOverride: grafana # Admin user password adminPassword: "s1cret0" # grafana configuration grafana.ini: server: domain: grafana.${CLUSTER_DOMAIN} root_url: "https://%(domain)s/" ## ## Provisioning sidecars ## sidecar: dashboards: # Enable dashboard sidecar enabled: true # Enable discovery in all namespaces searchNamespace: ALL # Search for ConfigMaps containing `grafana_dashboard` label label: grafana_dashboard # Annotation containing the folder where sidecar will place the dashboard. folderAnnotation: grafana_folder provider: # disableDelete to activate a import-only behaviour disableDelete: true # allow Grafana to replicate dashboard structure from filesystem foldersFromFilesStructure: true datasources: # Enable datasource sidecar enabled: true # Enable discovery in all namespaces searchNamespace: ALL # Search for ConfigMaps containing `grafana_datasource` label label: grafana_datasource labelValue: "1" ## Grafana HTTPRoute configuration route: main: enabled: true apiVersion: gateway.networking.k8s.io/v1 kind: HTTPRoute hostnames: - grafana.${CLUSTER_DOMAIN} parentRefs: - name: public-gateway namespace: envoy-gateway-system matches: - path: type: PathPrefix value: / # Kubernetes Monitoring ## Kubelet ## # Enable kubelet service kubeletService: ## Prometheus Operator creates Kubelet service ## Prometheus Operator started with options ## `--kubelet-service=kube-system/kube-prometheus-stack-kubelet` ## `--kubelet-endpoints=true` enabled: true namespace: kube-system ## Configuring Kubelet Monitoring kubelet: enabled: true serviceMonitor: enabled: true ## Kube API ## Configuring Kube API monitoring kubeApiServer: enabled: true serviceMonitor: # Enable Service Monitor enabled: true ## Kube Controller Manager kubeControllerManager: ## K3s controller manager is not running as a POD ## ServiceMonitor and Headless service is generated ## headless service is needed, So prometheus can discover each of the endpoints/PODs behind the service. ## ref: https://kubernetes.io/docs/concepts/services-networking/service/#headless-services ## Required headless service to extract the metrics the service need to be defined without selector and so the endpoints must be defined explicitly ## # ref: https://kubernetes.io/docs/concepts/services-networking/service/#services-without-selectors # Enable KubeController manager montoring enabled: true # endpoints : IP addresses of K3s control plane nodes endpoints: &cp - ${K8S_CP_NODE_1} - ${K8S_CP_NODE_2} - ${K8S_CP_NODE_3} service: # Enable creation of service enable: true serviceMonitor: # Enable and configure Service Monitor enabled: true ## Etcd monitoring kubeEtcd: enabled: true # K3s etcd not running as a POD, so endpoints need to be configured endpoints: *cp service: enabled: true port: 2381 targetPort: 2381 ## Kube Scheduler kubeScheduler: ## K3s Kube-scheduler is not running as a POD ## ServiceMonitor and Headless service is generated ## headless service is needed, So prometheus can discover each of the endpoints/PODs behind the service. ## ref: https://kubernetes.io/docs/concepts/services-networking/service/#headless-services ## Required headless service to extract the metrics the service need to be defined without selector and so the endpoints must be defined explicitly ## # ref: https://kubernetes.io/docs/concepts/services-networking/service/#services-without-selectors enabled: true # K3s kube-scheduler not running as a POD # Required headless service to extract the metrics the service need to be defined without selector and so the endpoints must be defined explicitly # # ref: https://kubernetes.io/docs/concepts/services-networking/service/#services-without-selectors endpoints: *cp serviceMonitor: enabled: true kubeProxy: ## K3s kube-proxy is not running as a POD ## ServiceMonitor and Headless service is generated ## headless service is needed, So prometheus can discover each of the endpoints/PODs behind the service. ## ref: https://kubernetes.io/docs/concepts/services-networking/service/#headless-services ## Required headless service to extract the metrics the service need to be defined without selector and so the endpoints must be defined explicitly ## enabled: true # K3s kube-proxy not running as a POD endpoints: - ${K8S_CP_NODE_1} - ${K8S_CP_NODE_2} - ${K8S_CP_NODE_3} - ${K8S_WK_NODE_1} - ${K8S_WK_NODE_2} - ${K8S_WK_NODE_2} serviceMonitor: enabled: true ## Core DNS monitoring ## coreDns: enabled: true # Creates headless service to get accest to all coreDNS Pods service: enabled: true port: 9153 # Enable service monitor serviceMonitor: enabled: trueNote:
Substitute variables (
${var}) in the above yaml file before deploying helm chart.- Replace
${CLUSTER_DOMAIN}by the domain name used in the cluster. For example:homelab.ricsanfre.comprometheus.${CLUSTER_DOMAIN},alertmanager.${CLUSTER_DOMAIN}andgrafana.${CLUSTER_DOMAIN}must resolve to Envoy Gateway’s Load Balancer service external IP. External-DNS can be configured to publish those records automatically fromHTTPRoutehostnames. - Replace
${CLUSTER_NAME}by the cluster name to be used as an external label in Prometheus metrics. This is useful when multiple clusters are federated or scraped from a central Prometheus instance, allowing to identify the source cluster of each metric. - Replace
${STORAGE_CLASS}by storage class name used (i.e.longhorn,local-path, etc.) - Replace
${K8S_CP_NODE_x}by cluster’s control node IP addresses. - Replace
${K8S_WK_NODE_x}by cluster’s worker node IP addresses.
- Replace
-
Step 4: Install kube-Prometheus-stack in
kube-prom-stacknamespacehelm upgrade --install kube-prometheus-stack prometheus-community/kube-prometheus-stack -f kube-prom-stack-values.yaml --namespace kube-prom-stack --create-namespace
Helm Chart Base Configuration
Cleaner resource Names
Following options in values.yaml files makes produce cleaner resources names removing kube-prom-stack prefix from all resources generated from subcharts deployef: Grafana, Node Exporter, Kube-State-Metrics
# Produce cleaner resources names
cleanPrometheusOperatorObjectNames:
# Prometheus Node Exporter Configuration
prometheus-node-exporter:
  # remove kube-prom-stack prefix
  fullnameOverride: node-exporter
# Kube-State-Metrics Configuration
kube-state-metrics:
  # remove kube-prom-stack prefix
  fullnameOverride: kube-state-metrics
# Grafana configuration
grafana:
  # remove kube-prom-stack prefix
  fullnameOverride: grafana
Prometheus Configuration
# Prometheus configuration
prometheus:
  prometheusSpec:
    ##
    ## Removing default filter Prometheus selectors
    ## Default selector filters defined by default in helm chart.
    ## matchLabels:
    ##   release: {{ $.Release.Name | quote }}
    ## ServiceMonitor, PodMonitor, Probe and Rules need to have label 'release' equals to kube-prom-stack helm release (kube-prom-stack)
    podMonitorSelectorNilUsesHelmValues: false
    probeSelectorNilUsesHelmValues: false
    ruleSelectorNilUsesHelmValues: false
    scrapeConfigSelectorNilUsesHelmValues: false
    serviceMonitorSelectorNilUsesHelmValues: false
    ##
    ## EnableAdminAPI enables Prometheus the administrative HTTP API which includes functionality such as deleting time series.
    ## This is disabled by default. --web.enable-admin-api command line
    ## ref: https://prometheus.io/docs/prometheus/latest/querying/api/#tsdb-admin-apis
    enableAdminAPI: true
    ##
    ## Configure access to Prometheus via dedicated hostname
    ## --web.external-url Prometheus command line parameter
    externalUrl: https://prometheus.${CLUSTER_DOMAIN}
    ##
    ## HA configuration: Replicas & Shards
    ## Number of replicas of each shard to deploy for a Prometheus deployment.
    ## Number of replicas multiplied by shards is the total number of Pods created.
    replicas: 1
    shards: 1
    ##
    ## TSDB Configuration
    ## ref: https://prometheus.io/docs/prometheus/latest/storage/#operational-aspects
    # Enable WAL compression
    walCompression: true
    # Retention data configuration
    retention: 14d
    retentionSize: 50GB
    ## Enable Experimental Features
    # ref: https://prometheus.io/docs/prometheus/latest/feature_flags/
    enableFeatures:
      # Enable Memory snapshot on shutdown.
      - memory-snapshot-on-shutdown
    # Additional external labels to be added to all metrics
    externalLabels:
      cluster: ${CLUSTER_NAME:-pi-cluster}
The following options are used to configure Prometheus Server
- Admin API is enabled (`prometheus.prometheusSpec.enableAdminAPI)
- Prometheus server configured to be exposed through Envoy Gateway using a dedicated hostname:
prometheus.prometheusSpec.externalUrl - HA configuration: Prometheus number of replicas and shards set to 1. Prometheus Operator is not deploying Prometheus replicas.
- Prometheus TSDB configuration:
- Enable WAL compression (
prometheus.prometheusSpec.walCompression) - Data retention configuration: set by
prometheus.prometheusSpec.retentionandprometheus.prometheusSpec.retentionSize
- Enable WAL compression (
- Experimental features enabled
- Enable “Memory-snapshot-on-shutdown”.
- Additional external labels to be added to all metrics, in this case, a
clusterlabel with the cluster name is added to all metrics. This is useful when multiple clusters are federated or scraped from a central Prometheus instance, allowing to identify the source cluster of each metric.
Grafana configuration
grafana:
  fullnameOverride: grafana
  # Admin user password
  adminPassword: "s1cret0"
  # grafana configuration
  grafana.ini:
    server:
      domain: grafana.${CLUSTER_DOMAIN}
      root_url: "https://%(domain)s/"
  ##
  ## Provisioning sidecars
  sidecar:
    dashboards:
      # Enable dashboard sidecar
      enabled: true
      # Enable discovery in all namespaces
      searchNamespace: ALL
      # Search for ConfigMaps containing `grafana_dashboard` label
      label: grafana_dashboard
      # Annotation containing the folder where sidecar will place the dashboard.
      folderAnnotation: grafana_folder
      provider:
        # disableDelete to activate a import-only behaviour
        disableDelete: true
        # allow Grafana to replicate dashboard structure from filesystem
        foldersFromFilesStructure: true
    datasources:
      # Enable datasource sidecar
      enabled: true
      # Enable discovery in all namespaces
      searchNamespace: ALL
      # Search for ConfigMaps containing `grafana_datasource` label
      label: grafana_datasource
      labelValue: "1"
The following options are used to configure Grafana
- Admin user password is set:
grafana.adminPassword - Grafana server configured with a dedicated public hostname:
serverconfiguration undergrafana.grafana.ini - Dynamic provisioning of dashboard: Configure Grafana’s dashboard sidecar to discover ConfigMaps containing dashboards definitions from all namespaces (
grafana.sidecar.dashboards.searchNamespaces) containing labelgrafana_dashboard. Annorationgrafana_foldercan be used to select the folder where the dashboard is placed. - Dynamic provisioning of datasources: Configure Grafana’s datasources sidecar to discover ConfigMaps containing dashboards definitions from all namespaces (
grafana.sidecar.datasources.searchNamespaces) containing labelgrafana_datasource
Gateway API Configuration
Pi Cluster exposes monitoring UIs through Envoy Gateway using Kubernetes Gateway API HTTPRoute resources. This is used as an alternative to Ingress resources, which are not used in this cluster, and allows to have a more flexible routing configuration and TLS management.
Each UI is published on its own hostname, attached to the shared public-gateway Gateway:
| UI | Endpoint |
|---|---|
| Grafana | grafana.${CLUSTER_DOMAIN} |
| Prometheus | prometheus.${CLUSTER_DOMAIN} |
| AlertManager | alertmanager.${CLUSTER_DOMAIN} |
The following values.yaml settings generate HTTPRoute resources for Prometheus and Alertmanager, and configure each application with its public URL. The same pattern can be used for Grafana when it is deployed as part of kube-prometheus-stack.
alertmanager:
  alertmanagerSpec:
    externalUrl: https://alertmanager.${CLUSTER_DOMAIN}
  route:
    main:
      enabled: true
      hostnames:
        - alertmanager.${CLUSTER_DOMAIN}
      parentRefs:
        - name: public-gateway
          namespace: envoy-gateway-system
prometheus:
  prometheusSpec:
    name: prometheus
    externalUrl: https://prometheus.${CLUSTER_DOMAIN}
  route:
    main:
      enabled: true
      hostnames:
        - prometheus.${CLUSTER_DOMAIN}
      parentRefs:
        - name: public-gateway
          namespace: envoy-gateway-system
grafana:
  grafana.ini:
    server:
      domain: grafana.${CLUSTER_DOMAIN}
      root_url: "https://%(domain)s/"
  route:
    main:
      enabled: true
      apiVersion: gateway.networking.k8s.io/v1
      kind: HTTPRoute
      hostnames:
        - grafana.${CLUSTER_DOMAIN}
      parentRefs:
        - name: public-gateway
          namespace: envoy-gateway-system
      matches:
        - path:
            type: PathPrefix
            value: /
Note:
Gateway TLS is terminated by the shared Envoy Gateway listener, using a certificate managed by Cert-Manager for the Gateway resource instead of per-application Ingress annotations.
Before using this pattern:
- Install Gateway API CRDs and Envoy Gateway. See Envoy Gateway - Installation.
- Enable Gateway API support in Cert-Manager. See Envoy Gateway - Gateway and TLS termination.
- Configure External-DNS with Gateway API route sources if DNS records should be published automatically from
HTTPRoutehostnames. See DNS (CoreDNS and External-DNS) - Gateway API support.
In this repository’s production overlay, kube-prometheus-stack deploys Prometheus and Alertmanager, while Grafana is installed as a separate Helm release with its own HTTPRoute. See Grafana Kubernetes Installation.
POD Configuration: CPU and Memory limit Resources and Storage
Configures AlerManager and Prometheus’ PODs persistent volumes to use the class longhorn and defines volume sizes and limiting resources used by Prometheus POD
alertmanager:
  alertmanagerSpec:
    storage:
      volumeClaimTemplate:
        spec:
          storageClassName: ${STORAGE_CLASS}
          accessModes: ["ReadWriteOnce"]
          resources:
            requests:
              storage: 5Gi
prometheus:
  prometheusSpec:
    ##
    ## Limit POD Resources
    resources:
      requests:
        cpu: 100m
      limits:
        memory: 2000Mi
    ##
    ## POD Storage Spec
    storageSpec:
      volumeClaimTemplate:
        spec:
          storageClassName: ${STORAGE_CLASS}
          accessModes: ["ReadWriteOnce"]
          resources:
            requests:
              storage: 5Gi
Kubernetes Monitoring
Kubernetes system metrics
Kubernetes Documentation - System Metrics details the Kubernetes components exposing metrics in Prometheus format:
- kube-controller-manager (exposing
metricsendpoint at TCP 10257) - kube-proxy (exposing
/metricsendpoint at TCP 10249) - kube-apiserver (exposing
/metricsat Kubernetes API port TCP 6443) - kube-scheduler (exposing
/metricsendpoint at TCP 10259) - kubelet (exposing
/metrics,/metrics/cadvisor,/metrics/resourceand/metrics/probesendpoints at TCP 10250)
Note: Authentication is Required Authentication and encryption is required to access the metric service : HTTPS traffic and authenticated connection is required to get metrics. Kubernetes authorized service account is needed to access the metrics service.
Reading metrics requires authorization via a user, group or ServiceAccount with a ClusterRole that allows accessing /metrics. For example:
apiVersion: rbac.authorization.k8s.io/v1
kind: ClusterRole
metadata:
  name: prometheus
rules:
  - nonResourceURLs:
      - "/metrics"
    verbs:
      - get
Additional services monitoring
Additionally coreDNS and etcd database can be monitored. They both expose Prometheus
kube-prom-stack configuration
Configure Kubernetes control plane metrics endpoints (etcd, controllerManager, scheduler), providing IP addresses of the different nodes of the cluster.
Also if kube-proxy is used, list of Ip addresses of all nodes running the cluster need to be provided for extracting kube-proxy metrics. If Cilium CNI is used kubeProxy monitoring must be disabled, setting kubeProxy.enabled: false
# Kubernetes Monitoring
## Kubelet
##
# Enable kubelet service
kubeletService:
  ## Prometheus Operator creates Kubelet service
  ## Prometheus Operator started with options
  ## `--kubelet-service=kube-system/kube-prometheus-stack-kubelet`
  ## `--kubelet-endpoints=true`
  enabled: true
  namespace: kube-system

## Configuring Kubelet Monitoring
kubelet:
  enabled: true
  serviceMonitor:
    enabled: true

## Kube API
## Configuring Kube API monitoring
kubeApiServer:
  enabled: true
  serviceMonitor:
    # Enable Service Monitor
    enabled: true

## Kube Controller Manager
kubeControllerManager:
  ## K3s controller manager is not running as a POD
  ## ServiceMonitor and Headless service is generated
  ## headless service is needed, So prometheus can discover each of the endpoints/PODs behind the service.
  ## ref: https://kubernetes.io/docs/concepts/services-networking/service/#headless-services
  ## Required headless service to extract the metrics the service need to be defined without selector and so the endpoints must be defined explicitly
  ##
  # ref: https://kubernetes.io/docs/concepts/services-networking/service/#services-without-selectors

  # Enable KubeController manager montoring
  enabled: true
  # endpoints : IP addresses of K3s control plane nodes
  endpoints: &cp
    - ${K8S_CP_NODE_1}
    - ${K8S_CP_NODE_2}
    - ${K8S_CP_NODE_3}
  service:
    # Enable creation of service
    enable: true
  serviceMonitor:
    # Enable and configure Service Monitor
    enabled: true

## Etcd monitoring
kubeEtcd:
  enabled: true
  # K3s etcd not running as a POD, so endpoints need to be configured
  endpoints: *cp
  service:
    enabled: true
    port: 2381
    targetPort: 2381

## Kube Scheduler
kubeScheduler:
  ## K3s Kube-scheduler is not running as a POD
  ## ServiceMonitor and Headless service is generated
  ## headless service is needed, So prometheus can discover each of the endpoints/PODs behind the service.
  ## ref: https://kubernetes.io/docs/concepts/services-networking/service/#headless-services
  ## Required headless service to extract the metrics the service need to be defined without selector and so the endpoints must be defined explicitly
  ##
  # ref: https://kubernetes.io/docs/concepts/services-networking/service/#services-without-selectors
  enabled: true
  # K3s kube-scheduler not running as a POD
  # Required headless service to extract the metrics the service need to be defined without selector and so the endpoints must be defined explicitly
  #
  # ref: https://kubernetes.io/docs/concepts/services-networking/service/#services-without-selectors
  endpoints: *cp
  serviceMonitor:
    enabled: true

kubeProxy:
  ## K3s kube-proxy is not running as a POD
  ## ServiceMonitor and Headless service is generated
  ## headless service is needed, So prometheus can discover each of the endpoints/PODs behind the service.
  ## ref: https://kubernetes.io/docs/concepts/services-networking/service/#headless-services
  ## Required headless service to extract the metrics the service need to be defined without selector and so the endpoints must be defined explicitly
  ##
  enabled: true
  # K3s kube-proxy not running as a POD
  endpoints:
    - ${K8S_CP_NODE_1}
    - ${K8S_CP_NODE_2}
    - ${K8S_CP_NODE_3}
    - ${K8S_WK_NODE_1}
    - ${K8S_WK_NODE_2}
    - ${K8S_WK_NODE_2}
  serviceMonitor:
    enabled: true

## Core DNS monitoring
##
coreDns:
  enabled: true
  # Creates headless service to get accest to all coreDNS Pods
  service:
    enabled: true
    port: 9153
  # Enable service monitor
  serviceMonitor:
    enabled: true
What has been deployed by kube-stack?
Applications
Prometheus Operator
The above installation procedure, deploys Prometheus Operator and creates Prometheus and AlertManager CRDs, which make the operator to deploy the corresponding Prometheus and AlertManager PODs (as StatefulSets).
Note that the final specification can be changed in helm chart values (prometheus.prometheusSpec and alertmanager.alertmanagerSpec)
Prometheus Node Exporter
Node Exporter is a Prometheus exporter for hardware and OS metrics exposed by UNIX kernels, written in Go with pluggable metric collectors.
Prometheus Node exporter helm chart is deployed as a subchart of the kube-prometheus-stack helm chart. This chart deploys Prometheus Node Exporter in all cluster nodes as daemonset.
Default kube-prometheus-stack’s Helm Chart values.yml file contains default configuration for Node Exporter Helm chart under prometheus-node-exporter variable:
Default configuration just excludes from the monitoring several mount points and file types (extraArgs) and it creates the corresponding Prometheus Operator’s ServiceMonitor object to start scrapping metrics from this exporter.
Prometheus-node-exporter’s metrics are exposed in TCP port 9100 (/metrics endpoint) of each of the daemonset PODs.
Kube State Metrics
kube-state-metrics (KSM) is a simple service that listens to the Kubernetes API server and generates metrics about the state of the objects. KSM can be used to view metrics on deployments, nodes, pods, and more. KSM holds an entire snapshot of Kubernetes state in memory and continuously generates new metrics based off of it.
kube-state-metrics gathers data using the standard Kubernetes go client and Kubernetes API. This raw data is used to create snapshot of the state of the objects in Kubernetes cluster. it generate Prometheus compliant metrics that are exposed at /metricsendpoint on port 8080.

Prometheus Kube State Metrics helm chart is deployed as a subchart of the kube-prometheus-stack helm chart. This chart deploys kube-state-metrics agent.
In kube-prometheus-stack’s helm chart kube-state-metrics value is used to pass the configuration to kube-state-metrics’s chart.
Grafana
Grafana helm chart by default is deployed as a subchart of the kube-prometheus-stack helm chart. This chart deploys Grafana.
In kube-prometheus-stack’s helm chart grafana value is used to pass the configuration to grafana’s chart.
By default kube-prom-stack configures Grafana’s following features:
-
Enabling data-source and dashboards sidecars so automatic provisioning of dashobards and datasources, is enabled. This functionality is used by
kube-prom-stackto automatically provision Prometheus datasource and Kubernetes dashboards. See details in See “Grafana Kubernetes Configuration: Dynamic Provisioning of DataSources” and “Grafana Kubernetes Configuration: Dynamic Provisioning of Dashboards”. -
Generates Prometheus Operator’s
ServiceMonitor, so Prometheus can start scrapping metrics from Grafana application.
Prometheus Operator Configuration
Prometheus Server
kube-prom-stack generates Prometheus object, so Prometheus Operator can deploy a Prometheus Server in declarative way, using prometheus.prometheusSpec defined in Helm Chart
The resource generated can be obtained after deploying kube-prom-stack helm chart with the command:
kubectl get Prometheus kube-prometheus-stack -o yaml -n kube-prom-stack
The following is a sample file the command could generate:
apiVersion: monitoring.coreos.com/v1
kind: Prometheus
metadata:
  name: kube-prometheus-stack
  namespace: kube-prom-stack
spec:
  alerting:
    alertmanagers:
    - apiVersion: v2
      name: kube-prometheus-stack-alertmanager
      namespace: kube-proms-stack
      port: http-web
  enableAdminAPI: true
  enableFeatures:
  - memory-snapshot-on-shutdown
  evaluationInterval: 30s
  externalUrl: https://prometheus.${CLUSTER_DOMAIN}
  image: quay.io/prometheus/prometheus:v{$PROM_VERSION}
  listenLocal: false
  logFormat: logfmt
  logLevel: info
  paused: false
  podMonitorNamespaceSelector: {}
  podMonitorSelector: {}
  portName: http-web
  probeNamespaceSelector: {}
  probeSelector: {}
  replicas: 1
  resources:
    limits:
      memory: 2000Mi
    requests:
      cpu: 100m
  retention: 14d
  retentionSize: 50GB
  ruleNamespaceSelector: {}
  ruleSelector: {}
  scrapeConfigNamespaceSelector: {}
  scrapeConfigSelector: {}
  scrapeInterval: 30s
  securityContext:
    fsGroup: 2000
    runAsGroup: 2000
    runAsNonRoot: true
    runAsUser: 1000
    seccompProfile:
      type: RuntimeDefault
  serviceAccountName: kube-prometheus-stack-prometheus
  serviceMonitorNamespaceSelector: {}
  serviceMonitorSelector: {}
  shards: 1
  storage:
    volumeClaimTemplate:
      spec:
        accessModes:
        - ReadWriteOnce
        resources:
          requests:
            storage: 5Gi
        storageClassName: longhorn
  version: ${PROM_VERSION}
This Prometheus object specifies the following Prometheus configuration:
-
Prometheus version and image installed (
spec.versionandspec.image). Prometheus version,${PROM_VERSION}in the previous sample resource manifest file, depends on the kube-prom-stack release version. -
HA Configuration. Number of shards and replicas per shard (
spec.shardsandspec.replicas).Prometheus basic HA mechanism is implemented through replication. Two (or more) instances (replicas) need to be running with the same configuration except that they will have one external label with a different value to identify them. The Prometheus instances scrape the same targets and evaluate the same rules.
There is additional HA mechanims, Prometheus’ sharding, which splits targets to be scraped into shards and each shard is assigned to a Prometheus server instance (or to a set, number of replicas).
The main drawback of this sharding solution is that, to query all data, query federation (e.g. Thanos Query) and distributed rule evaluation engine (e.g. Thanos Ruler) should be deployed.
Number of shards matches the number of StatefulSet objects to be deployed and numner of replicas are the number of PODs of each StatefulSet.
Note:
In my cluster, HA mechanism is not configured yet (only one shard and one replica are specified). For details about HA configuration check Prometheus Operator: High Availability
-
AlertManager server connected to this instance of Prometheus for perfoming the alerting (
spec.alerting.alertManager). The connection parameters specified by default matches theAlertManagerobject created by kube-prometheus-stack -
Default scrape interval, how often Prometheus scrapes targets (
spec.scrapeInterval: 30sg). It can be overwitten in PodMonitor/ServiceMonitor/Probe particular configuration. -
Rules evaluation period, how often Prometheus evaluates rules (
evaluationInterval: 30s) -
Data retention policy (
retention: 14d) -
Public endpoint published through Envoy Gateway using the dedicated hostname configured in
spec.externalUrl. -
Persistent volume specification (
storage):volumeClaimTemplateused by the Statefulset objects deployed. In my case volume claim from Longhorn. -
Rules for filtering the Prometheus Operator Resources (
PodMonitor,ServiceMonitor,ProbeandPrometheusRule) that applies to this particular instance of Prometheus server. Filtering rules includes both<entity>NamespaceSelectorand<entity>Selectorto filter resources belonging to matching namespaces and seletors that this Prometheus server will take care of.Resource NameSpace Selector Filter PodMonitor spec.podMonitorNamespaceSelectorspec.podMonitorSelectorServiceMonitor spec.serviceMonitorNamespaceSelectorspec.serviceMonitorSelectorProbe spec.probeNamespaceSelectorspec.probeSelectorRule spec.ruleNamespaceSelectorspec.ruleSelectorScrapeConfig spec.scrapeConfigNamespaceSelectorspec.scrapeConfigSelectorThe following diagram, from official prometheus operator documentation, shows an example of how the filtering rules are applied. A Deployment and Service called my-app is being monitored by Prometheus based on a ServiceMonitor named my-service-monitor:
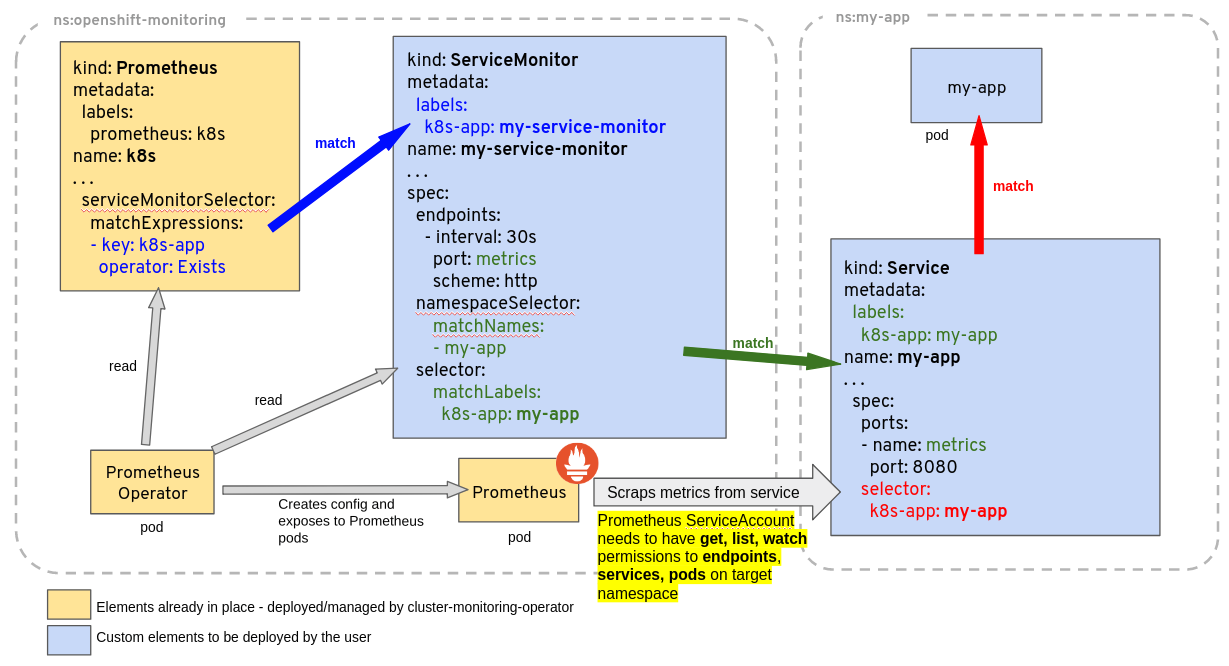
Source: Prometheus Operator Documentation By default kube-prometheus-stack values.yaml includes a default filter rule for objects (Namespace Selector filters are all null by default):
<entity>Selector:
  matchLabels:
    release: <kube-prometheus-stack helm releasea name>
With this rule all PodMonitor/ServiceMonitor/Probe/Prometheus rules resources must have a label:
release: kube-prometheus-stackfor being managed by the Prometheus ServerThis default filters can be removed providing the following values to helm chart:
prometheusSpec:
  ruleSelectorNilUsesHelmValues: false
  serviceMonitorSelectorNilUsesHelmValues: false
  podMonitorSelectorNilUsesHelmValues: false
  probeSelectorNilUsesHelmValues: false
  scrapeConfigSelectorNilUsesHelmValues: false
AlertManager Server
kube-prom-stack generates Alertmanager object, so Prometheus Operator can deploy a AlertManager Server in declarative way, using prometheus.alertManagerSpec defined in Helm Chart
The resource generated can be obtained after deploying kube-prom-stack helm chart with the command:
kubectl get AlertManager kube-prometheus-stack -o yaml -n kube-prom-stack
The following is a sample file the command could generate:
apiVersion: monitoring.coreos.com/v1
kind: Alertmanager
metadata:
  labels:
    name: kube-prometheus-stack
    namespace: kube-prom-stack
spec:
  alertmanagerConfigNamespaceSelector: {}
  alertmanagerConfigSelector: {}
  externalUrl: https://alertmanager.${CLUSTER_DOMAIN}
  image: quay.io/prometheus/alertmanager:${ALERTMANAGER_VERSION}
  listenLocal: false
  logFormat: logfmt
  logLevel: info
  paused: false
  portName: http-web
  replicas: 1
  retention: 120h
  securityContext:
    fsGroup: 2000
    runAsGroup: 2000
    runAsNonRoot: true
    runAsUser: 1000
    seccompProfile:
      type: RuntimeDefault
  serviceAccountName: kube-prometheus-stack-alertmanager
  storage:
    volumeClaimTemplate:
      spec:
        accessModes:
        - ReadWriteOnce
        resources:
          requests:
            storage: 5Gi
        storageClassName: longhorn
  version: ${ALERTMANAGER_VERSION}
This AlartManager object specifies the following Alert Manager configuration:
-
A version and image: v0.24.0 (
spec.versionandspec.image). AlertManager version,${ALERTMANAGER_VERSION}in the previous sample resource manifest file, depends on the kube-prom-stack release version installed. -
HA Configuration. Number of replicas (
spec.replicas). -
Data retention policy (
retention: 120h) -
Public endpoint published through Envoy Gateway using the dedicated hostname configured in
spec.externalUrl. -
Persistent volume specification (
storage: volumeClaimTemplate:) used by the Statefulset objects deployed. In my case volume claim from Longhorn.
ServiceMonitor
kube-prometheus-stack creates several ServiceMonitor objects to start scraping metrics from all the applications deployed:
- Node Exporter
- Grafana
- Kube-State-Metrics
- Prometheus
- AlertManager
- Prometheus Operator
and the following Kubernetes services and processes depending on the configuration of the helm chart.
- coreDNS
- Kube API server
- kubelet
- Kube Controller Manager
- Kubernetes Scheduler
- Kubernetes etcd
- Kube Proxy
The list can be obtained with following command:
kubectl get ServiceMonitor -A
NAMESPACE         NAME                                            AGE
kube-prom-stack   grafana                                         91m
kube-prom-stack   kube-prometheus-stack-alertmanager              91m
kube-prom-stack   kube-prometheus-stack-apiserver                 91m
kube-prom-stack   kube-prometheus-stack-coredns                   91m
kube-prom-stack   kube-prometheus-stack-kube-controller-manager   91m
kube-prom-stack   kube-prometheus-stack-kube-etcd                 91m
kube-prom-stack   kube-prometheus-stack-kube-proxy                91m
kube-prom-stack   kube-prometheus-stack-kube-scheduler            91m
kube-prom-stack   kube-prometheus-stack-kubelet                   91m
kube-prom-stack   kube-prometheus-stack-operator                  91m
kube-prom-stack   kube-prometheus-stack-prometheus                91m
kube-prom-stack   kube-state-metrics                              91m
kube-prom-stack   node-exporter                                   91m
Headless Services
For monitoring Kubernetes metric endpoints exposed by the different nodes of the cluster, kube-prometheus-stack creates a set of kubernetes headless service are created
These services have the following spec.clusterIP=None, allowing Prometheus to discover each of the pods behind the service. Since the metrics are exposed not by a pod but by a kubernetes process, the service need to be defined without selector and the endpoints must be defined explicitly.
kubectl get svc --field-selector spec.clusterIP=None -A
NAMESPACE         NAME                                            TYPE        CLUSTER-IP   EXTERNAL-IP   PORT(S)                        AGE
kube-prom-stack   alertmanager-operated                           ClusterIP   None         <none>        9093/TCP,9094/TCP,9094/UDP     125m
kube-prom-stack   prometheus-operated                             ClusterIP   None         <none>        9090/TCP                       125m
kube-system       kube-prometheus-stack-coredns                   ClusterIP   None         <none>        9153/TCP                       125m
kube-system       kube-prometheus-stack-kube-controller-manager   ClusterIP   None         <none>        10257/TCP                      125m
kube-system       kube-prometheus-stack-kube-etcd                 ClusterIP   None         <none>        2381/TCP                       125m
kube-system       kube-prometheus-stack-kube-proxy                ClusterIP   None         <none>        10249/TCP                      125m
kube-system       kube-prometheus-stack-kube-scheduler            ClusterIP   None         <none>        10259/TCP                      125m
kube-system       kube-prometheus-stack-kubelet                   ClusterIP   None         <none>        10250/TCP,10255/TCP,4194/TCP   125m
Prometheus Rules
kube-prometheus-stack creates several PrometheusRule resources to specify the alerts and the metrics that Prometheus generated based on the scraped metrics (alerting and record rules)
The rules provisioned can be found here: Prometheus rules created by kube-prometheus-stack chart.
kubectl get PrometheusRules -A
NAMESPACE         NAME                                                              AGE
kube-prom-stack   kube-prometheus-stack-alertmanager.rules                          95m
kube-prom-stack   kube-prometheus-stack-config-reloaders                            95m
kube-prom-stack   kube-prometheus-stack-etcd                                        95m
kube-prom-stack   kube-prometheus-stack-general.rules                               95m
kube-prom-stack   kube-prometheus-stack-k8s.rules.container-cpu-usage-seconds-tot   95m
kube-prom-stack   kube-prometheus-stack-k8s.rules.container-memory-cache            95m
kube-prom-stack   kube-prometheus-stack-k8s.rules.container-memory-rss              95m
kube-prom-stack   kube-prometheus-stack-k8s.rules.container-memory-swap             95m
kube-prom-stack   kube-prometheus-stack-k8s.rules.container-memory-working-set-by   95m
kube-prom-stack   kube-prometheus-stack-k8s.rules.container-resource                95m
kube-prom-stack   kube-prometheus-stack-k8s.rules.pod-owner                         95m
kube-prom-stack   kube-prometheus-stack-kube-apiserver-availability.rules           95m
kube-prom-stack   kube-prometheus-stack-kube-apiserver-burnrate.rules               95m
kube-prom-stack   kube-prometheus-stack-kube-apiserver-histogram.rules              95m
kube-prom-stack   kube-prometheus-stack-kube-apiserver-slos                         95m
kube-prom-stack   kube-prometheus-stack-kube-prometheus-general.rules               95m
kube-prom-stack   kube-prometheus-stack-kube-prometheus-node-recording.rules        95m
kube-prom-stack   kube-prometheus-stack-kube-scheduler.rules                        95m
kube-prom-stack   kube-prometheus-stack-kube-state-metrics                          95m
kube-prom-stack   kube-prometheus-stack-kubelet.rules                               95m
kube-prom-stack   kube-prometheus-stack-kubernetes-apps                             95m
kube-prom-stack   kube-prometheus-stack-kubernetes-resources                        95m
kube-prom-stack   kube-prometheus-stack-kubernetes-storage                          95m
kube-prom-stack   kube-prometheus-stack-kubernetes-system                           95m
kube-prom-stack   kube-prometheus-stack-kubernetes-system-apiserver                 95m
kube-prom-stack   kube-prometheus-stack-kubernetes-system-controller-manager        95m
kube-prom-stack   kube-prometheus-stack-kubernetes-system-kube-proxy                95m
kube-prom-stack   kube-prometheus-stack-kubernetes-system-kubelet                   95m
kube-prom-stack   kube-prometheus-stack-kubernetes-system-scheduler                 95m
kube-prom-stack   kube-prometheus-stack-node-exporter                               95m
kube-prom-stack   kube-prometheus-stack-node-exporter.rules                         95m
kube-prom-stack   kube-prometheus-stack-node-network                                95m
kube-prom-stack   kube-prometheus-stack-node.rules                                  95m
kube-prom-stack   kube-prometheus-stack-prometheus                                  95m
kube-prom-stack   kube-prometheus-stack-prometheus-operator                         95m
Grafana Configuration
DataSources
kube-prom-stack generates a configMap containing Grafana’s Prometheus and AlertManager data-sources, so Grafana can dynamically import it using provisioning sidecar.
apiVersion: v1
kind: ConfigMap
metadata:
  name: kube-prometheus-stack-grafana-datasource
  namespace: kube-prom-stack
    labels:
    grafana_datasource: "1"
data:
  datasource.yaml: |-
    apiVersion: 1
    datasources:
    - name: "Prometheus"
      type: prometheus
      uid: prometheus
      url: http://kube-prometheus-stack-prometheus.kube-prom-stack:9090/prometheus
      access: proxy
      isDefault: true
      jsonData:
        httpMethod: POST
        timeInterval: 30s
    - name: "Alertmanager"
      type: alertmanager
      uid: alertmanager
      url: http://kube-prometheus-stack-alertmanager.kube-prom-stack:9093/alertmanager
      access: proxy
      jsonData:
        handleGrafanaManagedAlerts: false
        implementation: prometheus
Dashboards
kube-prom-stack generates configMaps containing Grafana’s dashboards for displaying metrics of the monitored Services (Kubernetes, coreDNS, NodeExporter, Prometheus, Kube-State-Metrics, etc.)
List of dashboards can be queried with the following command:
kubectl get cm -l grafana_dashboard -n kube-prom-stack
As example:
kubectl get cm -l grafana_dashboard  -n kube-prom-stack
NAME                                                      DATA   AGE
kube-prometheus-stack-alertmanager-overview               1      8m15s
kube-prometheus-stack-apiserver                           1      8m15s
kube-prometheus-stack-cluster-total                       1      8m15s
kube-prometheus-stack-controller-manager                  1      8m15s
kube-prometheus-stack-etcd                                1      8m15s
kube-prometheus-stack-grafana-overview                    1      8m15s
kube-prometheus-stack-k8s-coredns                         1      8m15s
kube-prometheus-stack-k8s-resources-cluster               1      8m15s
kube-prometheus-stack-k8s-resources-multicluster          1      8m15s
kube-prometheus-stack-k8s-resources-namespace             1      8m15s
kube-prometheus-stack-k8s-resources-node                  1      8m15s
kube-prometheus-stack-k8s-resources-pod                   1      8m15s
kube-prometheus-stack-k8s-resources-workload              1      8m15s
kube-prometheus-stack-k8s-resources-workloads-namespace   1      8m15s
kube-prometheus-stack-kubelet                             1      8m15s
kube-prometheus-stack-namespace-by-pod                    1      8m15s
kube-prometheus-stack-namespace-by-workload               1      8m15s
kube-prometheus-stack-node-cluster-rsrc-use               1      8m15s
kube-prometheus-stack-node-rsrc-use                       1      8m15s
kube-prometheus-stack-nodes                               1      8m15s
kube-prometheus-stack-nodes-aix                           1      8m15s
kube-prometheus-stack-nodes-darwin                        1      8m15s
kube-prometheus-stack-persistentvolumesusage              1      8m15s
kube-prometheus-stack-pod-total                           1      8m15s
kube-prometheus-stack-prometheus                          1      8m15s
kube-prometheus-stack-proxy                               1      8m15s
kube-prometheus-stack-scheduler                           1      8m15s
kube-prometheus-stack-workload-total                      1      8m15s
Additional Configuration
Installing Grafana separately
Grafana helm chart by default is deployed as a sub-chart of the kube-prometheus-stack helm chart.
Grafana can be installed outside Kube-Prom-Stack to have better control of the installation (version and configuration).
This is the deployment model used in this repository’s production overlay: the Grafana sub-chart is disabled in kube-prometheus-stack, and Grafana is installed separately with its own Envoy Gateway HTTPRoute at grafana.${CLUSTER_DOMAIN}.
The following kube-prom-stack helm chart values.yaml disables Grafana subchart Helm chart installation (grafana.enabled: false). The creation of kube-prometheus-stack dashboards can be forced (grafana.forceDeployDashboards), so configMaps containing kube-prom-stack’s dashboards can be deployed.
Also annotation to all Grafana dashboards (ConfigMaps) can be added, so Grafana can deploy them into a specific folder (grafana_folder annotation)
# kube-prometheus-stack helm values (disable-grafana)
# Disabling instalation of Grafana sub-chart
grafana:
  enabled: false
  # Enable deployment of kube-prometheus-stack grafana dashboards
  forceDeployDashboards: true
  # Adding grafana folder annotation
  sidecar:
    dashboards:
      annotations:
        grafana_folder: Kubernetes
See “Grafana Kubernetes Installation” for installing Grafana separately and how to further configure it (Integation with Keycloak for single-sign-on, automate dashboards download from Grafana Labs. etc..
K3S Monitoring configuration
K3s configuration
Enabling remote access to /metrics endpoints
By default, K3S components (Scheduler, Controller Manager and Proxy) do not expose their endpoints to be able to collect metrics. Their /metrics endpoints are bind to 127.0.0.1, exposing them only to localhost, not allowing the remote query.
The following K3S installation arguments need to be provided, to change this behavior.
--kube-controller-manager-arg 'bind-address=0.0.0.0'
--kube-proxy-arg 'metrics-bind-address=0.0.0.0'
--kube-scheduler-arg 'bind-address=0.0.0.0
Enabling etcd metrics
In case etcd is used as cluster database, the following argument has to be provided to k3s control plane nodes:
--etcd-expose-metrics=true
Spegel Metrics
If Spegel add-on is configured, its metrics are automatically exposed via all K3s metrics endpoint. The Spegel metrics are mixed in with the rest of the metrics, which are exposed via all metrics endpoints due to how K3s runs all the Kubernetes components in a single process.
Spegel metrics are automatically recollected from kubelet metrics port. All K3s metrics are scrapped from kubelet metrics port to avoid K3s metrics duplication collection. See section below.
Spegel provides a Grafana dashboard in json format available in Spegel github repo:https://github.com/spegel-org/spegel/blob/main/charts/spegel/monitoring/grafana-dashboard.json
Dashboard can be automatically added using Grafana’s dashboard providers configuration. See further details in “PiCluster - Observability Visualization (Grafana): Automating installation of community dashboards
Add following configuration to Grafana’s helm chart values file:
# Configure default Dashboard Provider
# https://grafana.com/docs/grafana/latest/administration/provisioning/#dashboards
dashboardProviders:
  dashboardproviders.yaml:
    apiVersion: 1
    providers:
      - name: infrastructure
        orgId: 1
        folder: "Infrastructure"
        type: file
        disableDeletion: false
        editable: true
        options:
          path: /var/lib/grafana/dashboards/infrastructure-folder

# Add dashboard
# Dashboards
dashboards:
  infrastructure:
    spegel:
      url: https://raw.githubusercontent.com/spegel-org/spegel/refs/heads/main/charts/spegel/monitoring/grafana-dashboard.json
      datasource: Prometheus
K3S duplicate metrics issue
K3S distribution has a special behavior related to metrics exposure.
K3s deploys a single process in each cluster node: k3s-server running on master nodes or k3s-agent running on worker nodes. All kubernetes components running in the node share the same memory, and so K3s is emitting the same metrics in all /metrics endpoints available in a node: api-server, kubelet (TCP 10250), kube-proxy (TCP 10249), kube-scheduler (TCP 10251) and kube-controller-manager (TCP 10257). When polling one of the kubernetes components metrics endpoints, the metrics belonging to other kubernetes components are not filtered out.
k3s master, running all kubernetes components, is emitting the same metrics in all the ports. k3s workers, only running kubelet and kube-proxy components, emit the same metrics in both TCP 10250 and 10249 ports. By the other hand, kubelet additional metrics endpoints (/metrics/cadvisor, /metrics/resource and /metrics/probes) are only available at TCP 10250.
By default kube-prometheus-stack enables the scraping of all Kubernetes metrics endpoint (TCP Ports 10249,10250,10251, 10257 and apiserver) and that causes the ingestion of duplicated metrics. Duplicated metrics in Prometheus should be avoided so memory and CPU consumption can be reduced.
Two possible solutions:
- Remove duplicate metrics in Prometheus scrapping configuration, discarding duplicate metrics
- This solution avoid the ingestion of duplicates but it does not avoid the overlapping scrapping
- Lack of documentation about the metrics exposed by each endpoint makes difficult to configure the discarding metric rules.
- Disabling scrapping of most Kubernetes endpoints, keeping only
kubeletport scrapping (TCP: 10250):/metrics,/metrics/cadvisor,/metrics/resourceand/metrics/probes- This solution avoid both data duplication ingestion and overlapping scrapping
- As a draw-back, default kube-Prometheus-stack dashboards and prometheus rules are not valid since they use different
joblabels to identify metrics coming from different end-points). Dashboards and prometheus rules need to be generated sokubeletjobname is used.
Note:
See issue #67 for details about the analysis of the duplicates and the proposed solution
Solution: Monitor only kubelet endpoints and re-build K3s-compliant dashboards and prometheys rules
Disabling kube-prom-stack K8s monitoring
grafana:
  # The default dashboards are not working for `k3s`, so we disable them.
  defaultDashboardsEnabled: false
defaultRules:
  # The default rules are not working for `k3s`, so we disable them.
  create: false
# Source for issues/solutions: https://github.com/k3s-io/k3s/issues/3619#issuecomment-1425852034
# `k3s` exposes all metrics combined for each component, so we don't need to scrape them separately
# We'll only scrape kubelet, otherwise we'd get duplicate metrics.
kubelet:
  enabled: true
# Kubernetes API server collects data from master nodes, while kubelet collects data from master and worker nodes
# To not duplicate metrics we'll only scrape Kubelet
kubeApiServer:
  enabled: false
kubeControllerManager:
  enabled: false
kubeProxy:
  enabled: false
kubeScheduler:
  enabled: false
With this configuration, kube-prom-stack does not install any Grafana dashboard (grafana.defaultDashboardsEnabled false) or any Prometheus rule (defaultRules.create false)
Only Kubelet endpoint monitoring is kept, disabling monitoring of rest of Kubernetes components.
Creating Grafana and Prometheus rules from available mixins
The following process describe how to generate K3s-compliant Prometheus Monitoring Mixins1, replicating building process of kube-prom-stack.
Note:
Following procedure is an adapted version of the procedure described in https://hodovi.cc/blog/configuring-kube-prometheus-stack-dashboards-and-alerts-for-k3s-compatibility/
Big shout out to Adin Hodovic for describing the procedure in detail
The kube-prometheus project uses monitoring mixins to generate alerts and dashboards. Monitoring mixins are a collection of Jsonnet libraries that generate dashboards and alerts for Kubernetes. The kubernetes-mixin is a mixin that generates dashboards and alerts for Kubernetes. The node-exporter, coredns, grafana, prometheus and prometheus-operator mixins are also used to generate dashboards and alerts for the Kubernetes cluster.
Using jsonnet the kubernetes dashboards and Prometheus rules can be generated from mixins
Instead of installing go locally as described in the Adin’s blog, we will generate a jsonnet development environment using docker to build everything and extract the required yaml files
The following steps will create the following directory structure and files
k3s-mixins
├── build
│   ├── Dockerfile
│   ├── Makefile
│   ├── out
│   ├── src
│   │   ├── generate.sh
│   │   ├── main.jsonnet
└── kustomization.yaml
- Create a k3s-mixin building directory
mkdir -p k3s-mixins/build mkdir -p k3s-mixins/out mkidr -p k3s-mixins/src -
Create
k3s-mixins/build/src/main.jsonnet)Note:
Original version from Adin’s post has be updated to
- Include etcd mixin. Etcd metrics are exposed by k3s in the same way of the rest. So they can alsob be obtained from kubelet endpoint
- Adding
showMultiClusterconfig option to several of the mixins, so “cluster” variable in Dashboards is not displayed. This obtain same outcomes as kube-prom-stack helm chart hacking scripts generating manifest files from mixins: sync_grafana_dashboards.py#1L171
# We use helper functions from kube-prometheus to generate dashboards and alerts for Kubernetes. local addMixin = (import 'kube-prometheus/lib/mixin.libsonnet'); local kubernetesMixin = addMixin({ name: 'kubernetes', dashboardFolder: 'Kubernetes', mixin: (import 'kubernetes-mixin/mixin.libsonnet') + { _config+:: { cadvisorSelector: 'job="kubelet"', kubeletSelector: 'job="kubelet"', kubeSchedulerSelector: 'job="kubelet"', kubeControllerManagerSelector: 'job="kubelet"', kubeApiserverSelector: 'job="kubelet"', kubeProxySelector: 'job="kubelet"', showMultiCluster: false, }, }, }); local nodeExporterMixin = addMixin({ name: 'node-exporter', dashboardFolder: 'General', mixin: (import 'node-mixin/mixin.libsonnet') + { _config+:: { nodeExporterSelector: 'job="node-exporter"', showMultiCluster: false, }, }, }); local corednsMixin = addMixin({ name: 'coredns', dashboardFolder: 'DNS', mixin: (import 'coredns-mixin/mixin.libsonnet') + { _config+:: { corednsSelector: 'job="coredns"', }, }, }); local etcdMixin = addMixin({ name: 'etcd', dashboardFolder: 'Kubernetes', mixin: (import 'github.com/etcd-io/etcd/contrib/mixin/mixin.libsonnet') + { _config+:: { clusterLabel: 'cluster', }, }, }); local grafanaMixin = addMixin({ name: 'grafana', dashboardFolder: 'Grafana', mixin: (import 'grafana-mixin/mixin.libsonnet') + { _config+:: {}, }, }); local prometheusMixin = addMixin({ name: 'prometheus', dashboardFolder: 'Prometheus', mixin: (import 'prometheus/mixin.libsonnet') + { _config+:: { showMultiCluster: false, }, }, }); local prometheusOperatorMixin = addMixin({ name: 'prometheus-operator', dashboardFolder: 'Prometheus Operator', mixin: (import 'prometheus-operator-mixin/mixin.libsonnet') + { _config+:: {}, }, }); local stripJsonExtension(name) = local extensionIndex = std.findSubstr('.json', name); local n = if std.length(extensionIndex) < 1 then name else std.substr(name, 0, extensionIndex[0]); n; local grafanaDashboardConfigMap(folder, name, json) = { apiVersion: 'v1', kind: 'ConfigMap', metadata: { name: 'grafana-dashboard-%s' % stripJsonExtension(name), namespace: 'kube-prom-stack', labels: { grafana_dashboard: '1', }, }, data: { [name]: std.manifestJsonEx(json, ' '), }, }; local generateGrafanaDashboardConfigMaps(mixin) = if std.objectHas(mixin, 'grafanaDashboards') && mixin.grafanaDashboards != null then { ['grafana-dashboard-' + stripJsonExtension(name)]: grafanaDashboardConfigMap(folder, name, mixin.grafanaDashboards[folder][name]) for folder in std.objectFields(mixin.grafanaDashboards) for name in std.objectFields(mixin.grafanaDashboards[folder]) } else {}; local nodeExporterMixinHelmGrafanaDashboards = generateGrafanaDashboardConfigMaps(nodeExporterMixin); local kubernetesMixinHelmGrafanaDashboards = generateGrafanaDashboardConfigMaps(kubernetesMixin); local corednsMixinHelmGrafanaDashboards = generateGrafanaDashboardConfigMaps(corednsMixin); local etcdMixinHelmGrafanaDashboards = generateGrafanaDashboardConfigMaps(etcdMixin); local grafanaMixinHelmGrafanaDashboards = generateGrafanaDashboardConfigMaps(grafanaMixin); local prometheusMixinHelmGrafanaDashboards = generateGrafanaDashboardConfigMaps(prometheusMixin); local prometheusOperatorMixinHelmGrafanaDashboards = generateGrafanaDashboardConfigMaps(prometheusOperatorMixin); local grafanaDashboards = kubernetesMixinHelmGrafanaDashboards + nodeExporterMixinHelmGrafanaDashboards + corednsMixinHelmGrafanaDashboards + etcdMixinHelmGrafanaDashboards + grafanaMixinHelmGrafanaDashboards + prometheusMixinHelmGrafanaDashboards + prometheusOperatorMixinHelmGrafanaDashboards; local prometheusAlerts = { 'kubernetes-mixin-rules': kubernetesMixin.prometheusRules, 'node-exporter-mixin-rules': nodeExporterMixin.prometheusRules, 'coredns-mixin-rules': corednsMixin.prometheusRules, 'etcd-mixin-rules': etcdMixin.prometheusRules, 'grafana-mixin-rules': grafanaMixin.prometheusRules, 'prometheus-mixin-rules': prometheusMixin.prometheusRules, 'prometheus-operator-mixin-rules': prometheusOperatorMixin.prometheusRules, }; grafanaDashboards + prometheusAlerts -
Create script (
k3s-mixins/build/src/generate.sh) to automate the generation of the yaml files from the mixinsNote:
Original script from from Adin’s post has be updated to
- Yaml escape logic should be applied only to Prometheus Rules yaml files and not Dashboards yaml files. See kube-prom-stack ci/cd code generating prometheus-rules from mixins: sync_prometheus_rules.py#L259-L260
#!/bin/sh set -e # Exit on any error set -u # Treat unset variables as an error # Define paths MIXINS_DIR="./templates" # Function to escape YAML content escape_yaml() { local file_path="$1" echo "Escaping $file_path..." # Read the file content, process, and overwrite it sed -i \ -e 's/{{/{{`{{/g' \ -e 's/}}/}}`}}/g' \ -e 's/{{`{{/{{`{{`}}/g' \ -e 's/}}`}}/{{`}}`}}/g' \ "$file_path" echo "Escaped $file_path." } # Clean the templates directory echo "Cleaning templates directory..." rm -rf ${MIXINS_DIR}/* echo "Templates directory cleaned." # Convert Jsonnet to YAML echo "Converting Jsonnet to YAML..." jsonnet main.jsonnet -J vendor -m ${MIXINS_DIR} | xargs -I{} sh -c 'cat {} | gojsontoyaml > {}.yaml' -- {} echo "Jsonnet conversion completed." # Remove all non-YAML files echo "Removing non-YAML files..." find ${MIXINS_DIR} -type f ! -name "*.yaml" -exec rm {} + echo "Non-YAML files removed." # Escape brackets in the rules yaml files similar to how the kube-prometheus-stack Helm chart does. # https://github.com/prometheus-community/helm-charts/blob/main/charts/kube-prometheus-stack/hack/sync_prometheus_rules.py#L259-L260 echo "Escaping YAML files..." find ${MIXINS_DIR} -name '*-rules.yaml' | while read -r file; do escape_yaml "$file" done echo "YAML files escaped." echo "Processing completed successfully!" -
Create Dockerfile (
k3s-mixins/build/Dockerfile) to build and extract the generated yaml filesFROM golang:1.24.2-alpine AS build LABEL stage=builder WORKDIR /k3s-mixins COPY src/ . # Install required packages RUN apk add git # Install jsonnet and the jsonnet-bundler RUN go install github.com/google/go-jsonnet/cmd/jsonnet@latest RUN go install github.com/jsonnet-bundler/jsonnet-bundler/cmd/jb@latest # Install gojsontoyaml RUN go install github.com/brancz/gojsontoyaml@latest # Init Jsonnet project RUN jb init # Install mixinx RUN jb install github.com/kubernetes-monitoring/kubernetes-mixin@master RUN jb install github.com/prometheus-operator/kube-prometheus/jsonnet/kube-prometheus@main RUN jb install github.com/povilasv/coredns-mixin@master # Create output directory for the manifest files RUN mkdir templates # Execute command to generate RUN chmod +x generate.sh RUN ./generate.sh FROM scratch AS mixins COPY --from=build /k3s-mixins/templates / - Execute docker build command within
k3s-mixins/builddirectory to extract dashboards and rule files tooutdirectorycd k3x-mixins/builddocker build --no-cache --target mixins --output out/ . -
Go to
build/outdirectory and apply all manifest fileskubectl apply -f .
-
A monitoring mixin is a set of Grafana dashboards and Prometheus rules and alerts, packaged together in a reusable and extensible bundle. Mixins are written in jsonnet, and are typically installed and updated with jsonnet-bundler.
For more information about mixins, see:
- Prometheus Monitoring Mixins Design Doc. A cached pdf is included in this repo.
- For more motivation, see “The RED Method: How to instrument your services” talk from CloudNativeCon Austin 2018. The KLUMPs system demo’d became the basis for the kubernetes-mixin.
- “Prometheus Monitoring Mixins: Using Jsonnet to Package Together Dashboards, Alerts and Exporters” talk from CloudNativeCon Copenhagen 2018.
- “Prometheus Monitoring Mixins: Using Jsonnet to Package Together Dashboards, Alerts and Exporters” talk from PromCon 2018 (slightly updated).