Log Analytics (Elasticsearch and Kibana)
Elastic Cloud on Kubernetes (ECK) Operator is an implementation of Kubernetes Operator design pattern for deploying Elastic stack applications: ElasticSearch, Kibana, Logstash and other applications from Elastic ecosystem.
ECK Operator will be used to deploy Elasticsearh and Kibana.
ECK Operator installation
- Step 1: Add the Elastic repository:
helm repo add elastic https://helm.elastic.co - Step2: Fetch the latest charts from the repository:
helm repo update - Step 3: Create namespace
kubectl create namespace elastic - Step 3: Install ECK operator in the
elasticnamespacehelm install elastic-operator elastic/eck-operator --namespace elastic - Step 4: Monitor operator logs:
kubectl -n elastic logs -f statefulset.apps/elastic-operator
Elasticsearch installation
Basic instructions can be found in ECK Documentation: “Deploy and elasticsearch cluster”
-
Step 1: Create a manifest file containing basic configuration: one node elasticsearch using Longhorn as storageClass and 5GB of storage in the volume claims.
apiVersion: elasticsearch.k8s.elastic.co/v1
kind: Elasticsearch
metadata:
  name: efk
  namespace: elastic
spec:
  version: 8.15.0
  nodeSets:
  - name: default
    count: 1    # One node elastic search cluster
    config:
      node.store.allow_mmap: false # Disable memory mapping
    volumeClaimTemplates:
      - metadata:
          name: elasticsearch-data
        spec:
          accessModes:
          - ReadWriteOnce
          resources:
            requests:
              storage: 5Gi
          storageClassName: ${STORAGE_CLASS}
  http:
    tls: # Disabling TLS automatic configuration.
      selfSignedCertificate:
        disabled: true
Note:
Substitute variables (
${var}) in the above yaml file before deploying mangifest file.- Replace
${STORAGE_CLASS}by storage class name used (i.e.longhorn,local-path, etc.)
-
About Virtual Memory configuration (mmap)
By default, Elasticsearch uses memory mapping (
mmap) to efficiently access indices. To disable this default mechanism add the following configuration option:node.store.allow_nmap: falseUsually, default values for virtual address space on Linux distributions are too low for Elasticsearch to work properly, which may result in out-of-memory exceptions. This is why
mmapis disable.For production workloads, it is strongly recommended to increase the kernel setting
vm.max_map_countto 262144 and leavenode.store.allow_mmapunset.See further details in ECK Documentation: “Elastisearch Virtual Memory”
-
About Persistent Storage configuration
Longhorn is configured for Elastisearch POD’s persistent volumes
volumeClaimTemplates:
  - metadata:
      name: elasticsearch-data
    spec:
      accessModes:
      - ReadWriteOnce
      resources:
        requests:
          storage: 5Gi
      storageClassName: ${STORAGE_CLASS}
See how to configure PersistenVolumeTemplates for Elasticsearh using this operator in ECK Documentation: “Volume claim templates”
-
Disable TLS configuration
http:
  tls:
    selfSignedCertificate:
      disabled: true
By default ECK configures secured communications with auto-signed SSL certificates. Access to its service endpoint on port 9200 is only available through https.
Disabling TLS automatic configuration in Elasticsearch HTTP server enables Cluster Service Mesh to gather more statistics about connections. Service Mesh is parsing plain text traffic (HTTP) instead of encrypted (HTTPS).
Cluster service mesh will enforce secure communications using TLS between all PODs.
-
About limiting resources assigned to ES
In Kubernetes, limits in the consumption of resources (CPU and memory) can be assigned to PODs. See “Kubernetes Doc - Resource Management for Pods and Containers”.
resource requestsdefines the minimum amount of resources that must be available for a Pod to be scheduled;resource limitsdefines the maximum amount of resources that a Pod is allowed to consume.When you specify the
resource requestfor containers in a Pod, the kube-scheduler uses this information to decide which node to place the Pod on. When you specify aresource limitfor a container, the kubelet enforces those limits so that the running container is not allowed to use more of that resource than the limit you set. The kubelet also reserves at least the request amount of that system resource specifically for that container to use.In case of using ECK Operator is it recommended to specify those resource limits and resource request to each of the Objects created by the Operator. See details on how to setup those limits in ECK Documentation - Manage compute resources.
For example memory heap assigned to JVM is calculated based on that resource limits, “The heap size of the JVM is automatically calculated based on the node roles and the available memory. The available memory is defined by the value of
resources.limits.memoryset on the elasticsearch container in the Pod template, or the available memory on the Kubernetes node is no limit is set”.By default, ECK does not specify any limit to CPU resource and it defines
resources.limits.memoryfor ElasticSearch POD set to 2GB.In production environment this default limit should be increased. In lab environments where memory resources are limited it can be decreased to reduce ES memory footprint.
In both scenarios, the limit can be changed in in
Elasticsearchobject (podTemplatesection).podTemplate: # Limiting Resources consumption spec: containers: - name: elasticsearch resources: requests: memory: 1Gi limits: memory: 1Gi
- Replace
-
Step 2: Apply manifest
kubectl apply -f manifest.yml -
Step 3: Check Elasticsearch status
kubectl get elasticsearch -n elastic
NAME   HEALTH   NODES   VERSION   PHASE   AGE
efk    green   1       8.15.0    Ready   139m
Note:
Elasticsearch status
HEALTH=greenindicates that Elasticsearch is running and healthy,PHASE=Readyindicates that the server is up and running
Elasticsearch authentication
By default ECK configures user authentication to access elasticsearch service. ECK defines a default admin esaticsearch user (elastic) and with a password which is stored within a kubernetes Secret.
Both to access elasticsearch from Kibana GUI or to configure Fluentd collector to insert data, elastic user/password need to be provided.
Password is stored in a kubernetes secret (<efk_cluster_name>-es-elastic-user). Execute this command for getting the password
kubectl get secret -n elastic efk-es-elastic-user -o=jsonpath='{.data.elastic}' | base64 --decode; echo
File-based Authentication
ECK has the capability to define additional custom users and roles. Custom users are added using ES File-based Authentication. Custom roles can also be added using ES file-based roles
Important:
Users/roles including in file realm cannot be managed using the user APIs, or using the Kibana Management > Security > Users/Roles pages. File based used/roles are defined at ES node level. All nodes of a cluster should have same users/roles configured. ECK operator guarantees that all nodes of the cluster have the same file-based users/roles.
See Users and roles from elastic cloud-on-k8s documentation.
To allow fluentd and prometheus exporter to access our elasticsearch cluster, we can define two role that grants the necessary permission for the two users we will be creating (fluentd, prometheus).
-
Step 1: Create Secrets containing roles definitions
Fluentd user role:
kind: Secret
apiVersion: v1
metadata:
  name: es-fluentd-roles-secret
  namespace: elastic
stringData:
  roles.yml: |-
    fluentd_role:
      cluster: ['manage_index_templates', 'monitor', 'manage_ilm']
      indices:
      - names: [ '*' ]
        privileges: [
          'indices:admin/create',
          'write',
          'create',
          'delete',
          'create_index',
          'manage',
          'manage_ilm'
        ]
Prometheus Exporter user role:
kind: Secret apiVersion: v1 metadata: name: es-prometheus-roles-secret namespace: elastic stringData: roles.yml: |- prometheus_role: cluster: [ 'monitor', 'monitor_snapshot' ] indices: - names: [ '*' ] privileges: [ 'monitor', 'view_index_metadata' ] -
Step 2. Create the Secrets containing user name, password and mapped role
Fluentd user:
apiVersion: v1
kind: Secret
metadata:
  name: es-fluentd-user-file-realm
  namespace: elastic
type: kubernetes.io/basic-auth
data:
  username: <`echo -n 'fluentd' | base64`>
  password: <`echo -n 'supersecret' | base64`>
  roles: <`echo -n 'fluentd_role' | base64`>
Prometheus exporter user:
apiVersion: v1 kind: Secret metadata: name: es-prometheus-user-file-realm namespace: elastic type: kubernetes.io/basic-auth data: username: <`echo -n 'prometheus' | base64`> password: <`echo -n 'supersecret' | base64`> roles: <`echo -n 'prometheus_role' | base64`> -
Step 3: Modify Elasticsearch yaml file created in step 1 of ES installation.
Add the following lines to ElasticSearch manifest file:
apiVersion: elasticsearch.k8s.elastic.co/v1
kind: Elasticsearch
metadata:
  name: efk
  namespace: elastic
spec:
  auth:
    roles:
    - secretName: es-fluentd-roles-secret
    - secretName: es-prometheus-roles-secret
    fileRealm:
    - secretName: es-fluentd-user-file-realm
    - secretName: es-prometheus-user-file-realm
...
In addition to the elastic user we can also create an super user account for us to login, we can create the account just like how we created the fluentd or prometheus user, but instead with the role set to superuser.
Accesing Elasticsearch from outside the cluster
By default Elasticsearh HTTP service is accessible through Kubernetes ClusterIP service types (only available within the cluster). In Pi Cluster it is exposed externally through Envoy Gateway using a Kubernetes Gateway API HTTPRoute.
This exposure will be useful for doing remote configurations on Elasticsearch through its API from pimaster node. For example: to configure backup snapshots.
-
Step 1. Create the
HTTPRoutemanifestapiVersion: gateway.networking.k8s.io/v1 kind: HTTPRoute metadata: name: elasticsearch namespace: elastic spec: parentRefs: - name: public-gateway namespace: envoy-gateway-system hostnames: - elasticsearch.${CLUSTER_DOMAIN} rules: - backendRefs: - name: efk-es-http port: 9200Note:
Substitute variables (
${var}) in the above yaml file before deploying manifest.- Replace
${CLUSTER_DOMAIN}by the domain name used in the cluster. For example:homelab.ricsanfre.com.
Envoy Gateway exposes Elasticsearch as
elasticsearch.${CLUSTER_DOMAIN}through the sharedpublic-gatewayGateway. TLS is terminated at the Gateway using the wildcard certificate managed for Envoy Gateway.See “Envoy Gateway - Gateway and TLS termination” for details.
External-DNS can automatically create a DNS entry from the
HTTPRoutehostname when Gateway API route sources are enabled. See “DNS (CoreDNS and External-DNS) - Gateway API support”. - Replace
-
Step 2: Apply manifest
kubectl apply -f manifest.yml -
Step 3. Access to Elastic HTTP service
Elasticsearch HTTP endpoint can be accessed through
https://elasticsearch.${CLUSTER_DOMAIN}using loginelasticand the password stored in<efk_cluster_name>-es-elastic-user.It should shows the following output (json message)
{
  "name" : "efk-es-default-0",
  "cluster_name" : "efk",
  "cluster_uuid" : "WTb_fupJRl27biWOnJY5tQ",
  "version" : {
    "number" : "8.15.0",
    "build_flavor" : "default",
    "build_type" : "docker",
    "build_hash" : "1a77947f34deddb41af25e6f0ddb8e830159c179",
    "build_date" : "2024-08-05T10:05:34.233336849Z",
    "build_snapshot" : false,
    "lucene_version" : "9.11.1",
    "minimum_wire_compatibility_version" : "7.17.0",
    "minimum_index_compatibility_version" : "7.0.0"
  },
  "tagline" : "You Know, for Search"
}
Kibana installation
-
Step 1. Create a manifest file
apiVersion: kibana.k8s.elastic.co/v1 kind: Kibana metadata: name: kibana namespace: elastic spec: version: 8.15.0 count: 1 elasticsearchRef: name: "efk" http: # NOTE disabling kibana automatic TLS configuration tls: selfSignedCertificate: disabled: true - Step 2: Apply manifest
kubectl apply -f manifest.yml - Step 3: Check kibana status
kubectl get kibana -n elastic
NAME   HEALTH   NODES   VERSION   AGE
efk    green    1       8.15.0    171m
Note:
Kibana status
HEALTH=greenindicates that Kibana is up and running.
Gateway API route for Kibana
Make Kibana UI accessible from outside the cluster through Envoy Gateway.
-
Step 1. Create the
HTTPRoutemanifestapiVersion: gateway.networking.k8s.io/v1 kind: HTTPRoute metadata: name: kibana namespace: elastic spec: parentRefs: - name: public-gateway namespace: envoy-gateway-system hostnames: - kibana.${CLUSTER_DOMAIN} rules: - backendRefs: - name: efk-kb-http port: 5601Note:
Substitute variables (
${var}) in the above yaml file before deploying manifest.- Replace
${CLUSTER_DOMAIN}by the domain name used in the cluster. For example:homelab.ricsanfre.com.
Envoy Gateway exposes Kibana as
kibana.${CLUSTER_DOMAIN}through the sharedpublic-gatewayGateway. TLS is terminated at the Gateway using the wildcard certificate managed for Envoy Gateway.See “Envoy Gateway - Gateway and TLS termination” for details.
External-DNS can automatically create a DNS entry from the
HTTPRoutehostname when Gateway API route sources are enabled. See “DNS (CoreDNS and External-DNS) - Gateway API support”. - Replace
- Step 2: Apply manifest
kubectl apply -f manifest.yml -
Step 3. Access to Kibana UI
UI can be accessed through
https://kibana.${CLUSTER_DOMAIN}using loginelasticand the password stored in<efk_cluster_name>-es-elastic-user.Execute the following command to get
elasticuser passwordkubectl get secret efk-es-elastic-user -o jsonpath='{.data.elastic}' -n elastic | base64 -d;echo
Initial Kibana Setup (DataView configuration)
Kibana’s DataView must be configured in order to access Elasticsearch data.
Note:
This configuration must be done once data from fluentd has been inserted in ES: A index (fluentd-*) containing data has been created.
-
Step 1: Open Kibana UI
Open a browser and go to Kibana’s URL (kibana.picluster.ricsanfre.com)
-
Step 2: Open “Management Menu”
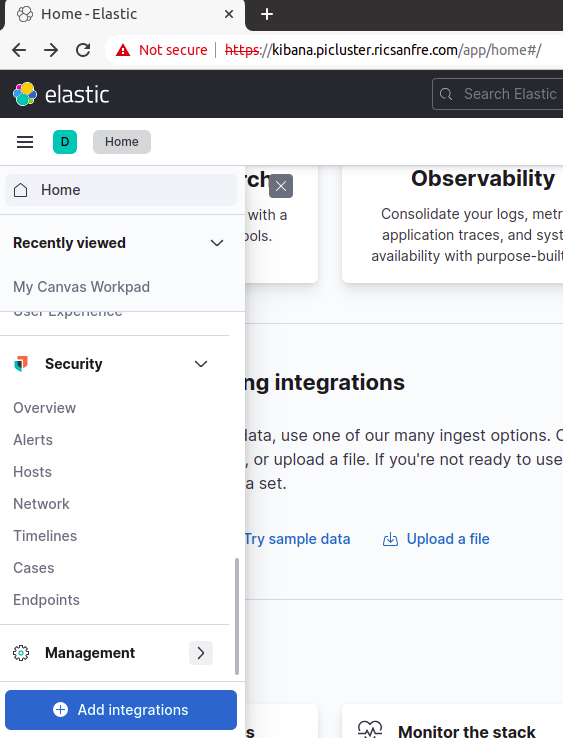
-
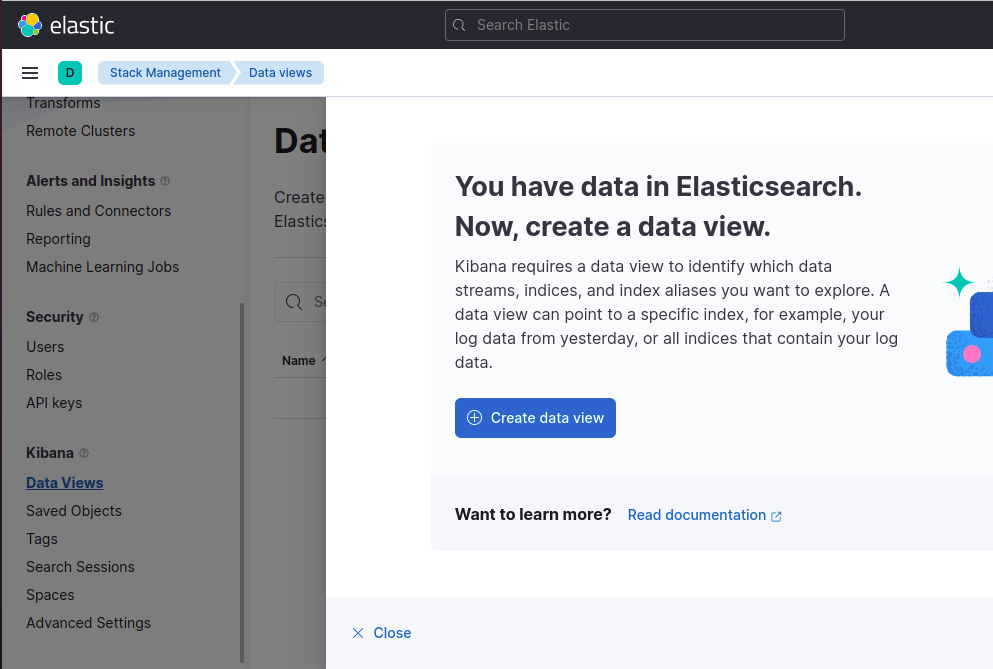
Step 3: Select “Kibana - Data View” menu option and click on “Create data view”
-
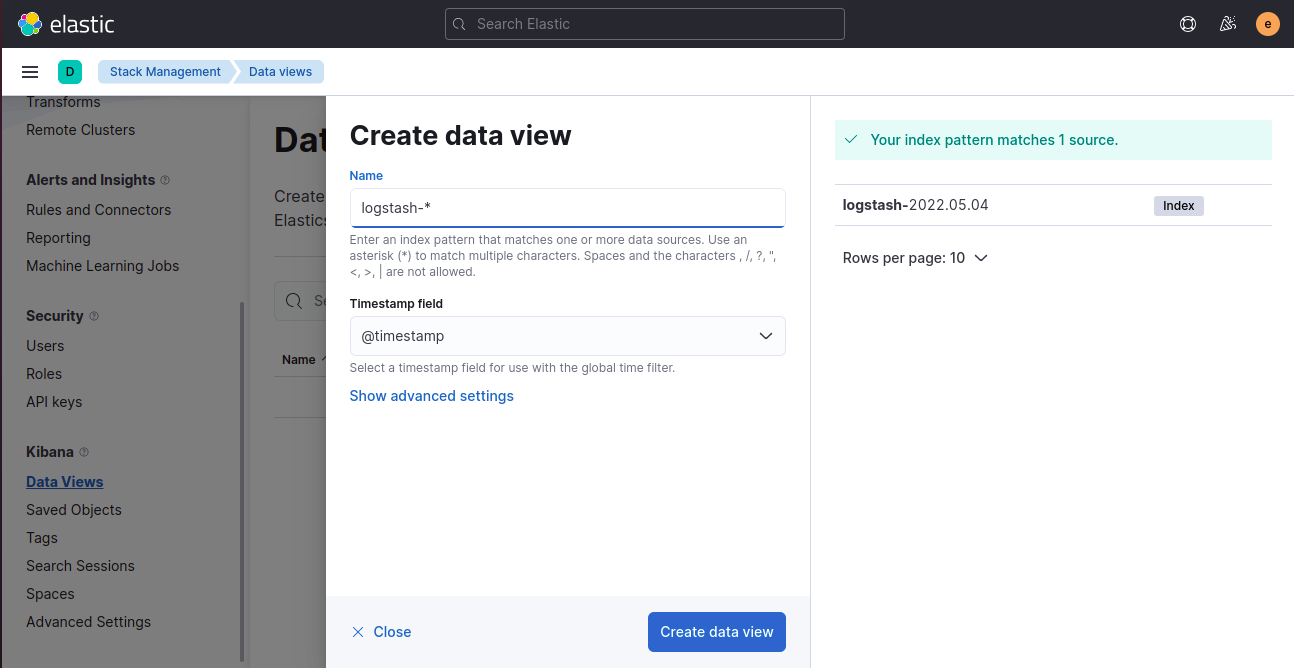
Step 4: Set index pattern to fluentd-* and timestamp field to @timestamp and click on “Create Index”
Automation using API
Kibana’s dataview can be automatically creatred using Kibana’s API DataView endpoint.
A Kubernetes Job can be created to automatically invoke API to create the required API.
The following configMap contains two scripts to be executed by the Job:
wait-for-kibana.sh: it test the connection to Kibana, and wait till Kibana is availablecreate-data-view.sh: Create a Dataview using Kibana API.
apiVersion: v1
kind: ConfigMap
metadata:
  name: kibana-config-data
data:
  wait-for-kibana.sh: |
    #!/bin/sh
    # Wait for Kibana to be available & healthy
    echo "Testing connection to Kibana"
    until $(curl -k -X GET http://$KIBANA_URL:$KIBANA_PORT/_cluster/health); do sleep 5; done
    until [ "$(curl -k -X GET http://$KIBANA_URL:$KIBANA_PORT/_cluster/health | wc -l)" == "0" ]
    do sleep 5
    done

  create-data-view.sh: |
    #!/bin/sh
    #Import data view
    echo "Importing data_view..."
    curl -u elastic:$ELASTICSEARCH_PASSWORD \
    -X POST http://$KIBANA_URL:$KIBANA_PORT/api/data_views/data_view \
    -H 'Content-Type: application/json; Elastic-Api-Version=2023-10-31' \
    -H 'kbn-xsrf: string' \
    -d '
    {
      "data_view": {
        "name": "fluentd",
        "title": "fluentd-*",
        "timeFieldName": "@timestamp"
      }
    }
    '
The Job is the following:
apiVersion: batch/v1
kind: Job
metadata:
  name: kibana-config-job
spec:
  parallelism: 1
  completions: 1
  template:
    spec:
      restartPolicy: Never
      initContainers:
        - name: wait-for-kibana
          image: alpine/curl:latest
          imagePullPolicy: IfNotPresent
          env:
          - name: KIBANA_URL
            value: efk-kb-http
          - name: KIBANA_PORT
            value: "5601"
          command: ["/bin/sh","/kibana/wait-for-kibana.sh"]
          volumeMounts:
          - name: kibana-config-data
            mountPath: /kibana/
      containers:
        - name: kibana-config-job
          image: alpine/curl:latest
          env:
            - name: ELASTICSEARCH_PASSWORD
              valueFrom:
                secretKeyRef:
                  name: efk-es-elastic-user
                  key: elastic
            - name: KIBANA_URL
              value: efk-kb-http
            - name: KIBANA_PORT
              value: "5601"
          command: ["/bin/sh","/kibana/create-data-view.sh"]
          volumeMounts:
          - name: kibana-config-data
            mountPath: /kibana/
      volumes:
      - name: kibana-config-data
        configMap:
          name: kibana-config-data
          defaultMode: 0777
Configuring ElasticStack
Automating configuration with Terraform and Flux Tofu Controller
As an alternative to manual API calls, ElasticStack configuration can be managed with OpenTofu/Terraform.
This repository already includes an Elastic Terraform module to configure Elasticsearch and Kibana resources (roles, users, ILM policies, templates, and dataviews) in a declarative way. The module can be executed manually or automatically with Flux Tofu Controller.
Module: terraform/elastic/
Providers used in the module:
- ElasticStack provider: elastic/elasticstack (OpenTofu Registry)
- Vault provider: hashicorp/vault (OpenTofu Registry)
- Kubernetes provider: hashicorp/kubernetes (OpenTofu Registry)
The Terraform module manages ElasticStack resources from JSON files in terraform/elastic/resources/.
JSON schema and examples are documented in terraform/elastic/JSON_FORMAT_GUIDE.md.
roles/*.jsonusers/*.jsonpolicies/*.jsontemplate_components/*.jsontemplates/*.jsondataviews/*.json
Vault Provider
The module authenticates to Vault using the hashicorp/vault provider (OpenTofu Registry) and supports two execution modes:
- Direct/local execution (
tofu_controller_execution=false):- Uses
vault_token.
- Uses
- In-cluster Tofu Controller execution (
tofu_controller_execution=true):- Uses Kubernetes auth login (
vault_kubernetes_auth_login_path, defaultauth/kubernetes/login). - Uses Vault role
vault_kubernetes_auth_role(in this repo,tf-runner). - Uses service account token from
kubernetes_token_file(default/var/run/secrets/kubernetes.io/serviceaccount/token).
- Uses Kubernetes auth login (
The module reads users credentials from Vault KV v2 (vault_kv2_path, default secret) using vault_secret_key in each file under resources/users/*.json.
Automating with Tofu Controller
The Terraform module can be automatically reconciled by Flux Tofu Controller, which executes the Terraform code and applies the configuration to Elasticsearch and Kibana.
For general controller installation and operational concepts, see Flux Tofu Controller Usage.
Tofu Controller resource used in this repository:
- Flux Terraform CR:
kubernetes/platform/elastic-stack/config/base/terraform.yaml
How it works
- Flux source-controller publishes the Git artifact.
- Tofu Controller reconciles the
Terraformcustom resource. - The module authenticates to Vault using Kubernetes auth role
tf-runner. - The module reads user passwords from Vault and applies Elasticsearch/Kibana configuration declaratively.
Example Terraform custom resource (already present in this repo):
apiVersion: infra.contrib.fluxcd.io/v1alpha2
kind: Terraform
metadata:
  name: config-elastic
spec:
  interval: 30m
  approvePlan: auto
  destroyResourcesOnDeletion: true
  path: ./terraform/elastic
  sourceRef:
    kind: GitRepository
    name: flux-system
    namespace: flux-system
  vars:
    - name: tofu_controller_execution
      value: "true"
    - name: vault_address
      value: "https://vault.${CLUSTER_DOMAIN}:8200"
    - name: vault_kubernetes_auth_login_path
      value: "auth/kubernetes/login"
    - name: vault_kubernetes_auth_role
      value: "tf-runner"
    - name: elasticsearch_endpoint
      value: "http://efk-es-http.elastic.svc:9200"
    - name: kibana_endpoint
      value: "http://efk-kb-http.elastic.svc:5601"
Operational workflow
- Edit JSON files under
terraform/elastic/resources/. - Commit and push changes to the Git branch watched by Flux.
- Reconcile and verify:
flux reconcile terraform config-elastic -n flux-system
kubectl -n flux-system get terraform config-elastic
kubectl -n flux-system describe terraform config-elastic
Note:
Prerequisite: Vault Kubernetes auth must include the tf-runner role bound to the Tofu runner service account in flux-system, and policies must allow reading all secrets required by the Elastic Terraform module.
For the actual tf-runner Vault role/policy configuration and CLI snippets, see Flux Tofu Controller: Vault access from tf-runner (Kubernetes auth).
Observability
Metrics
Prometheus Integration via Elasticsearh exporter
In order to monitor elasticsearch with prometheus, prometheus-elasticsearch-exporter need to be installed.
For doing the installation prometheus-elasticsearch-exporter official helm will be used.
-
Step 1: Add the prometheus community repository
helm repo add prometheus-community https://prometheus-community.github.io/helm-charts -
Step 2: Fetch the latest charts from the repository
helm repo update -
Step 3: Create values.yml for configuring the helm chart
---
# Elastic search password from secret
extraEnvSecrets:
  ES_USERNAME:
    secret: es-prometheus-user-file-realm
    key: username
  ES_PASSWORD:
    secret: es-prometheus-user-file-realm
    key: password
# Elastic search URI
es:
  uri: http://efk-es-http:9200

# Enable Service Monitor
serviceMonitor:
  ## If true, a ServiceMonitor CRD is created for a prometheus operator
  ## https://github.com/coreos/prometheus-operator
  ##
  enabled: true
This config passes ElasticSearch API endpoint (uri) and the needed credentials through environement variables(ES_USERNAME and ES_PASSWORD). The es-prometheus-user-file-realm secret was created in section Elasticsearch authentication.
-
Step 3: Install prometheus-elasticsearh-exporter in the
elasticnamespace with the overriden valueshelm install -f values.yml prometheus-elasticsearch-exporter prometheus-community/prometheus-elasticsearch-exporter --namespace elastic
When deployed, the exporter generates a Kubernetes Service exposing prometheus-elasticsearch-exporter metrics endpoint (/metrics on port 9108)
It can be tested with the following command:
curl prometheus-elasticsearch-exporter.logging.svc.cluster.local:9108/metrics
# HELP elasticsearch_breakers_estimated_size_bytes Estimated size in bytes of breaker
# TYPE elasticsearch_breakers_estimated_size_bytes gauge
elasticsearch_breakers_estimated_size_bytes{breaker="eql_sequence",cluster="efk",es_client_node="true",es_data_node="true",es_ingest_node="true",es_master_node="true",host="10.42.2.20",name="efk-es-default-0"} 0
elasticsearch_breakers_estimated_size_bytes{breaker="fielddata",cluster="efk",es_client_node="true",es_data_node="true",es_ingest_node="true",es_master_node="true",host="10.42.2.20",name="efk-es-default-0"} 0
elasticsearch_breakers_estimated_size_bytes{breaker="inflight_requests",cluster="efk",es_client_node="true",es_data_node="true",es_ingest_node="true",es_master_node="true",host="10.42.2.20",name="efk-es-default-0"} 0
elasticsearch_breakers_estimated_size_bytes{breaker="model_inference",cluster="efk",es_client_node="true",es_data_node="true",es_ingest_node="true",es_master_node="true",host="10.42.2.20",name="efk-es-default-0"} 0
...
Integration with Kube-prom-stack
Providing serviceMonitor.enabled: true to the helm chart values.yaml file, corresponding Prometheus Operator’s resource, ServiceMonitor, so Kube-Prometheus-Stack can automatically start scraping metrics form this endpoint
Grafana Dashboards
See Grafana Operator - Provisioning Dashboards for the general GrafanaDashboard onboarding patterns.
Elasticsearh exporter dashboard sample can be donwloaded from prometheus-elasticsearh-exporter repo.
The dashboard can be onboarded with a GrafanaDashboard resource:
apiVersion: grafana.integreatly.org/v1beta1
kind: GrafanaDashboard
metadata:
  name: elasticsearch
spec:
  allowCrossNamespaceImport: true
  folder: Infrastructure
  instanceSelector:
    matchLabels:
      dashboards: grafana
  url: https://raw.githubusercontent.com/prometheus-community/elasticsearch_exporter/master/elasticsearch-mixin/compiled/dashboards/cluster.json