Logging Architecture
EFK vs PLG Stacks
Two different stacks can be deployed as centralized logging solution for the kubernetes cluster:
- EFK stack (Elasticsearch-Fluentd/Fluentbit-Kibana), where:
- Elasticsearch is used as logs storage and search engine
- Fluentd/Fluentbit used for collecting, aggregate and distribute logs
- Kibana is used as visualization layer.
This is a mature open-source stack for implementing centralized log management and log analytics capabilities. Since Elasticsearch indexes the whole content of the logs the resources required by the solution in terms of storage and memory are high.
- PLG stack (Promtail - Loki - Grafana), where:
- Promtail is used as log collector
- Loki as log storage/aggregator
- Grafana as visualization layer.
Loki is a lightweigh alternative to Elasticsearch providing a horizontally-scalable, highly-available, multi-tenant log aggregation system inspired by Prometheus for Kubernetes environments.
Loki consumption of resources is lower than ES because it does not index the contents of the logs, it rather indexes a set of labels for each log stream.
Important: About Promtail deprecation
Promtail has been deprecated, since Feb 2025 no new features are added and only support is provided till its EOL is March 2026.
Grafana Alloy Agent, generic telemetry agent, is the new component to be used in Grafana observability stack.
In the cluster both stacks can be deployed to deliver complimentary logs-based monitoring (observability) and advance log analytics capabilities.
The logging architecture will have the following components:
-
Loki as key component of the Observability platform. Loki, managing logs like prometheus metrics, with the same labels, makes possible to join in the same Grafana dashboards metrics (prometheus), logs (Loki) and traces (Tempo) belonging to the same context (pod, application, container). This way Grafana can be used as single plane of glass for monitoring cluster services.
-
ElasticSearh/Kibana providing advance log analytics capabilities. Loki indexing capabilities are limited to logs labels while ES indexes whole content of the logs. Kibana provides many visualization tools to do analysis on ES indexed data, such as location maps, machine learning for anomaly detection, and graphs to discover relationships in data.
-
Common architecture for log collection, aggregation and distribution based on Fluentbit/Fluentd. Fluentbit/Fluentd can be used to distribute logs to both logs storage platform (ES and Loki) instead of deploying two separate log collectors (Fluentbit and Promtail).
Fluentbit/Fluentd selected over Promtail, because it is a general purpose log colletor/distributor, that can be used to ingest logs from different sources (not only kubernetes), parsing and filtering them, and route them to different destinations. Promtail is tailored only to work only with Loki.
Note:
In the cluster you can decide to install EFK (Elatic-Fluent-Kibana) stack or FLG (Fluent-Loki-Grafana) stack or both, sharing the same log collection and distribution layer (Fluentbit/Fluentd)
The architecture is shown in the following picture

Important: ARM/Kubernetes support
In June 2020, Elastic announced that starting from 7.8 release they will provide multi-architecture docker images supporting AMD64 and ARM64 architectures.
Fluentd and Fluentbit both support ARM64 docker images for being deployed on Kubernetes clusters with the built-in configuration needed to automatically collect and parsing containers logs.
Loki also supports ARM64 docker images.
Log collection, aggregation and distribution architectures
Two different architectures can be implemented with Fluentbit and Fluentd
Forwarder-only architecture
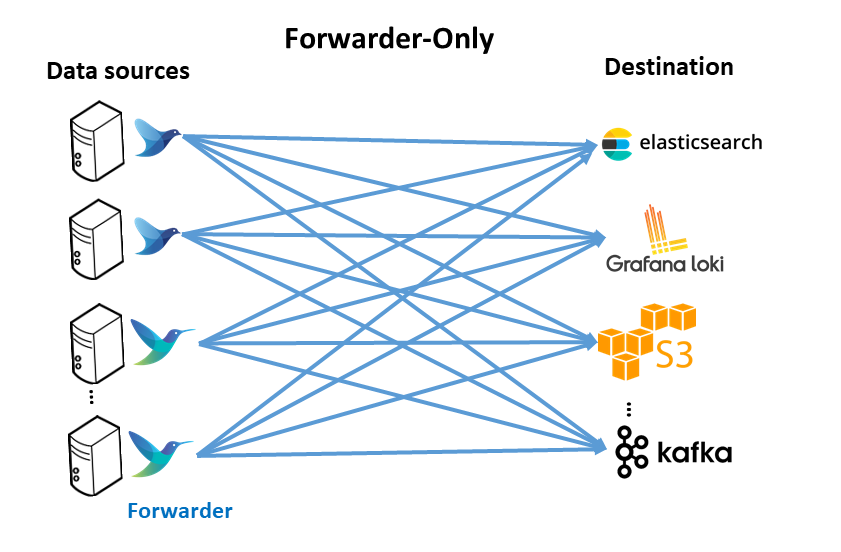
This pattern includes having a logging agent, based on fluentbit or fluentd, deployed on edge (forwarder), generally where data is created, such as Kubernetes nodes, virtual machines or baremetal servers. These forwarder agents collect, parse and filter logs from the edge nodes and send data direclty to a backend service.
Advantages
- No aggregator is needed; each agent handles backpressure.
Disadvantages
- Hard to change configuration across a fleet of agents (E.g., adding another backend or processing)
- Hard to add more end destinations if needed
Forwarder/Aggregator Architecture
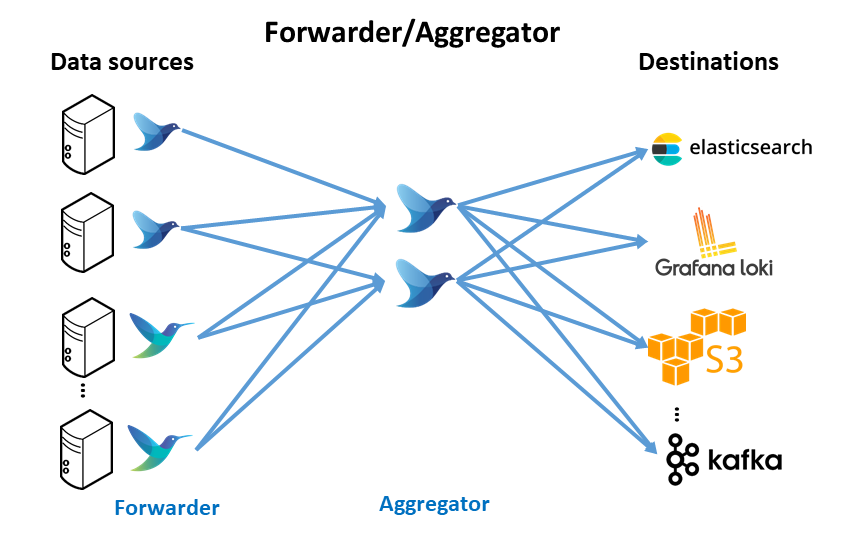
Similar to the forwarder-only deployment, lightweight logging agent instance is deployed on edge (forwarder) close to data sources (kubernetes nodes, virtual machines or baremetal servers). In this case, these forwarders do minimal processing and then use the forward protocol to send data to a much heavier instance of Fluentd or Fluent Bit (aggregator). This heavier instance may perform more filtering and processing before routing to the appropriate backend(s).
Advantages
-
Less resource utilization on the edge devices (maximize throughput)
-
Allow processing to scale independently on the aggregator tier.
-
Easy to add more backends (configuration change in aggregator vs. all forwarders).
Disadvantages
- Dedicated resources required for an aggregation instance.
With this architecture, in the aggregation layer, logs can be filtered and routed to different logs backends: Elastisearch and Loki. In the future different backend can be added to do further online processing. For example Kafka can be deployed as backend to build a Data Streaming Analytics architecture (Kafka, Apache Spark, Flink, etc) and route only the logs from a specfic application.
Log Management solution for the Pi Cluster
Forwarder/Aggregator architecture will be deployed in the cluster.
Both fluentbit and fluentd can be deployed as forwarder and/or aggregator.
The differences between fluentbit and fluentd can be found in Fluentbit documentation: “Fluentd & Fluent Bit”.
Main differences are:
-
Memory footprint: Fluentbit is a lightweight version of fluentd (just 640 KB memory)
-
Number of plugins (input, output, filters connectors): Fluentd has more plugins available, but those plugins need to be installed as gem libraries. Fluentbit’s plugins do not need to be installed.
In this deployment fluentbit is installed as forwarder (plugins available are enough for collecting and parsing kubernetes logs and host logs) and fluentd as aggregator to leverage the bigger number of plugins available.
Note: About Fluent Operator
Fluent Operator can be used to deploy forwarder/aggregation architecture in a Kubernetes Cluster. Fluent Operator applies Kubernetes controller design pattern enabling the declarative definition of the Fluentbit/Fluentd architecture to deploy. It supports the following forwarder/aggregationo control logs data pipelines in 3 modes:
- Fluent Bit only mode: Deploy just Fluentbit as collection and distribution/aggregation layer.
- Fluent Bit + Fluentd mode: Deploy Fluentbit as collector and Fluentd as distribution/aggregation layer to perform more complicated processing of logs.
- Fluentd only mode: Deploy just Fluentd as collection and distribution/aggregation layer
Most of the fluent-bit and fluentd plugins, used in PiCluster project, are supported by Fluent Operator, but currently there is a limitation related to observability capabilites: Fluentd obsevability cannot be configured, Fluent Operator does not support fluentd’s Prometheus plugin configuration. See Fluent Operator issue #725
Becasue of this limitation Fluent Operator is not used in the Kubernetes Cluster
For additional details about all common architecture patterns that can be implemented with Fluentbit and Fluentd see “Common Architecture Patterns with Fluentd and Fluent Bit”.
Logging solution installation procedure
The procedure for deploying logging solution stack is described in the following pages: