OpenTelemetry Collector
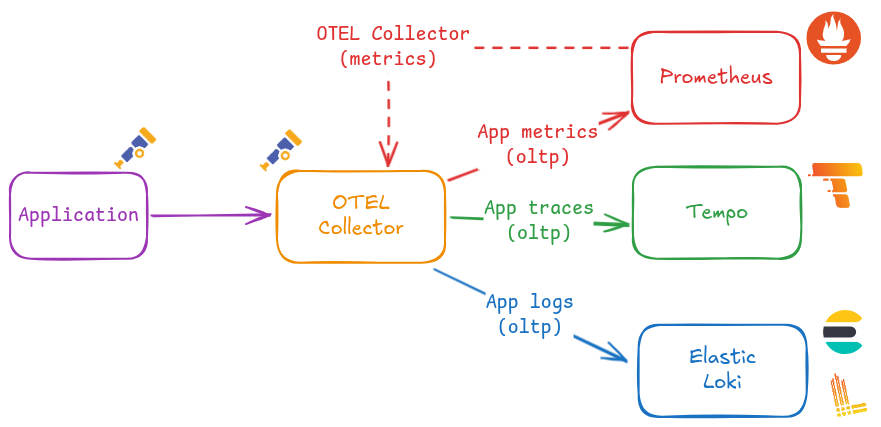
The OpenTelemetry Collector is the central component of the OpenTelemetry-based observability architecture used in Pi Cluster.
It receives telemetry signals generated by applications and platform components, processes them, enriches them with Kubernetes metadata, and exports them to the observability backends already deployed in the cluster.
In Pi Cluster, the collector is used as the standard OTLP ingestion point for metrics, traces and logs. It complements the traditional Prometheus and Fluent-based collection path described in Observability solution.
What is OpenTelemetry Collector?
OpenTelemetry Collector is a vendor-neutral telemetry gateway. It can receive, process and export telemetry data independently of the application runtime or backend vendor.
The collector uses a pipeline model composed of four main building blocks:
- Receivers, which ingest telemetry from clients and agents. In Pi Cluster the collector uses OTLP receivers, and the Helm chart can also expose Jaeger, Zipkin and Prometheus receivers.
- Processors, which transform, enrich, batch or limit the telemetry before export.
- Connectors, which connect pipelines. In Pi Cluster, the
spanmetricsconnector derives metrics from traces. - Exporters, which send telemetry to the final storage or analysis backend.
This architecture allows the same collector instance to receive telemetry once and then distribute each signal type to the most suitable backend.
Collector architecture in Pi Cluster
The collector is deployed in namespace otel from the OpenTelemetry Helm chart and uses the otel/opentelemetry-collector-contrib image so community exporters and connectors are available.
The architecture implemented in this repository is the following:
- Applications and platform components send telemetry to the collector using OTLP gRPC or OTLP HTTP.
- The collector enriches telemetry with Kubernetes metadata using the
kubernetesAttributespreset. - A
resourceprocessor insertsservice.instance.idusingk8s.pod.uid. - The
spanmetricsconnector generates metrics from trace spans. - Telemetry is exported to the different backends:
- traces to Tempo
- metrics to Prometheus through the OTLP HTTP ingestion endpoint - logs to Elasticsearch and Loki
Pipeline layout
The production configuration defines four active pipelines:
- Traces pipeline: processors
memory_limiter,resource,batch; exportersspanmetrics,otlp - Metrics pipeline: receivers
otlp,spanmetrics; processorsmemory_limiter,resource,batch; exporterotlphttp/prometheus - Logs Elasticsearch pipeline: receivers
otlp; processorsmemory_limiter,resource,batch; exporterelasticsearch - Logs Loki pipeline: receivers
otlp; processorsmemory_limiter,resource,batch,transform/loki; exporterotlphttp/loki
The two log pipelines use the names logs/elasticsearch and logs/loki so both exporters can coexist in the same collector configuration.
Internal telemetry
The collector also exports its own internal telemetry using OTLP HTTP to http://otel-collector:4318. This allows the collector to observe itself and expose detailed internal metrics.
External exposure
In addition to the internal Kubernetes service, the production overlay creates an HTTPRoute attached to the public gateway so the collector can be reached through:
otel-collector.${CLUSTER_DOMAIN}
It also enables CORS on the OTLP HTTP receiver so browser-based telemetry clients can send OTLP HTTP traffic from cluster domains.
OpenTelemetry Collector installation
Pi Cluster deploys the collector using the upstream OpenTelemetry Helm chart.
Helm installation steps
Installation using Helm (Release 3):
-
Step 1: Add the OpenTelemetry Helm repository:
helm repo add open-telemetry https://open-telemetry.github.io/opentelemetry-helm-charts -
Step 2: Fetch the latest charts from the repository:
helm repo update -
Step 3: Create namespace:
kubectl create namespace otel -
Step 4: Create
otel-collector-values.yamlfile with the following content:image: repository: otel/opentelemetry-collector-contrib fullnameOverride: otel-collector mode: deployment presets: kubernetesAttributes: enabled: true resources: limits: memory: 200Mi service: type: ClusterIP ports: metrics: enabled: true podAnnotations: prometheus.io/scrape: "true" extraEnvs: - name: ELASTIC_USER valueFrom: secretKeyRef: name: otel-elasticsearch-exporter-secret key: es-username - name: ELASTIC_PASSWORD valueFrom: secretKeyRef: name: otel-elasticsearch-exporter-secret key: es-password config: receivers: otlp: protocols: http: cors: allowed_origins: - "http://*.${CLUSTER_DOMAIN}" - "https://*.${CLUSTER_DOMAIN}" extensions: basicauth: client_auth: username: "$${env:ELASTIC_USER}" password: "$${env:ELASTIC_PASSWORD}" exporters: otlp: endpoint: tempo-distributor-discovery.tempo.svc.cluster.local:4317 tls: insecure: true otlphttp/prometheus: endpoint: http://kube-prometheus-stack-prometheus.kube-prom-stack.svc:9090/api/v1/otlp tls: insecure: true otlphttp/loki: endpoint: http://loki-gateway.loki/otlp elasticsearch: endpoint: http://efk-es-http.elastic:9200 auth: authenticator: basicauth processors: resource: attributes: - key: service.instance.id from_attribute: k8s.pod.uid action: insert transform/loki: log_statements: - context: log statements: - set(resource.attributes["exporter"], "OTLP") - set(resource.attributes["k8s.namespace.name"], log.attributes["k8s.namespace.name"]) - delete_key(log.attributes, "k8s.namespace.name") connectors: spanmetrics: {} service: extensions: - health_check - basicauth pipelines: traces: processors: [memory_limiter, resource, batch] exporters: [spanmetrics, otlp] metrics: receivers: [otlp, spanmetrics] processors: [memory_limiter, resource, batch] exporters: [otlphttp/prometheus] logs/elasticsearch: receivers: [otlp] processors: [memory_limiter, resource, batch] exporters: [elasticsearch] logs/loki: receivers: [otlp] processors: [memory_limiter, resource, batch, transform/loki] exporters: [otlphttp/loki] telemetry: metrics: level: detailed readers: - periodic: interval: 10000 timeout: 5000 exporter: otlp: protocol: http/protobuf endpoint: http://otel-collector:4318 -
Step 5: Install OpenTelemetry Collector:
helm install opentelemetry-collector open-telemetry/opentelemetry-collector \ --namespace otel \ -f otel-collector-values.yaml -
Step 6: Confirm that the deployment succeeded:
kubectl get pods -n otel
kubectl get svc -n otel
OTEL Collector Configuration
Generic configuration
Image
The collector uses the otel/opentelemetry-collector-contrib image to have access to community receivers and exporters such as elasticsearch and spanmetrics.
Deployment mode
The collector is deployed as a Kubernetes Deployment, which provides better resource management and stability for production workloads compared to the DaemonSet mode.
mode: deployment
Kubernetes attributes preset
The kubernetesAttributes preset is enabled to automatically enrich telemetry with Kubernetes metadata such as k8s.pod.name, k8s.namespace.name, and k8s.node.name.
See details in the OpenTelemetry Helm chart documentation.
Activating this preset adds the Kubernetes attributes processor to each pipeline: OpenTelemetry Kubernetes Attributes Processor
OLTP Receiver configuration
OTLP HTTP CORS configuration
OLTP HTTP receiver can be configured to enable CORS so browser-based clients can send telemetry to the collector:
Add following configuration to helm values:
config:
  receivers:
    otlp:
      protocols:
        http:
          cors:
            allowed_origins:
              - "http://*.${CLUSTER_DOMAIN}"
              - "https://*.${CLUSTER_DOMAIN}"
This is especially useful for front-end applications exporting telemetry through OTLP HTTP.
Tempo exporter
Trace pipeline is configured with an otlp exporter pointing to Tempo:
config:
  exporters:
    otlp:
      endpoint: tempo-distributor-discovery.tempo.svc.cluster.local:4317
      tls:
        insecure: true
  service:
    pipelines:
      traces:
        processors: [memory_limiter, resource, batch]
        exporters: [spanmetrics, otlp]
This configuration makes the collector the central ingestion point for distributed tracing, while Tempo remains the traces backend.
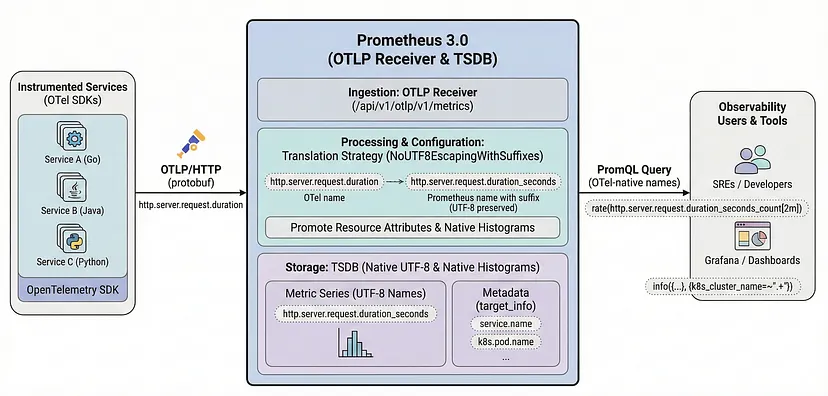
Prometheus exporter
Metrics pipeline is configured with an otlphttp/prometheus exporter pointing to the Prometheus OTLP HTTP ingestion endpoint:
config:
  exporters:
    otlphttp/prometheus:
      endpoint: http://kube-prometheus-stack-prometheus.kube-prom-stack.svc:9090/api/v1/otlp
      tls:
        insecure: true
  service:
    pipelines:
      metrics:
        receivers: [otlp, spanmetrics]
        processors: [memory_limiter, resource, batch]
        exporters: [otlphttp/prometheus]
This allows Prometheus to ingest OpenTelemetry metrics directly through its OTLP endpoint, while scrape-based Prometheus monitoring continues to coexist for traditional workloads.
Before this exporter can be used, Prometheus itself must enable the OpenTelemetry receiver.
Enabling the OpenTelemetry receiver in Prometheus
 |
|---|
| Source: Prometheus and OpenTelemetry Finally Grew Up Together |
Installation steps:
-
Step 1: Add the following options to the
kube-prometheus-stackHelm values:# kube-prom-stack helm values (open-telemetry-receiver) # Enable the OpenTelemetry receiver in Prometheus to receive OTLP data. # ref: https://prometheus.io/docs/guides/opentelemetry/#send-opentelemetry-metrics-to-the-prometheus-server # ref: https://github.com/prometheus-community/helm-charts/issues/5080#issuecomment-3035180394 prometheus: prometheusSpec: # Enabling OTLP receiver enableOTLPReceiver: true otlp: promoteResourceAttributes: - service.instance.id - service.name - service.namespace - cloud.availability_zone - cloud.region - container.name - deployment.environment.name - k8s.cluster.name - k8s.container.name - k8s.cronjob.name - k8s.daemonset.name - k8s.deployment.name - k8s.job.name - k8s.namespace.name - k8s.pod.name - k8s.replicaset.name - k8s.statefulset.name translationStrategy: NoUTF8EscapingWithSuffixes keepIdentifyingResourceAttributes: true tsdb: outOfOrderTimeWindow: 30mWhere:
-
enableOTLPReceiver: trueenables the Prometheus OTLP receiver so the Prometheus server exposes/api/v1/otlp. -
promoteResourceAttributespromotes OpenTelemetry resource attributes to Prometheus labels. This ensures that Kubernetes metadata and service information attached to OpenTelemetry telemetry is preserved when ingested by Prometheus. -
translationStrategy: NoUTF8EscapingWithSuffixesensures that OpenTelemetry resource attributes are translated to Prometheus labels without character escaping and with the_otelsuffix to avoid conflicts with existing Prometheus labels. -
keepIdentifyingResourceAttributes: trueensures that resource attributes used for identifying metrics are preserved during translation. -
tsdb.outOfOrderTimeWindow: 30mconfigures Prometheus to accept out-of-order samples with a maximum time window of 30 minutes, which is useful for handling telemetry data that may arrive with some delay.
See further details in the Prometheus documentation and in the kube-prometheus-stack issue discussion.
-
-
Step 2: Apply or upgrade the Prometheus Helm release with those values.
helm upgrade kube-prometheus-stack prometheus-community/kube-prometheus-stack \
    --namespace kube-prom-stack \
    -f kube-prometheus-stack-values.yaml
Once the Helm release is deployed, Prometheus starts serving the OTLP ingestion endpoint and OpenTelemetry Collector can export metrics to:
http://kube-prometheus-stack-prometheus.kube-prom-stack.svc:9090/api/v1/otlp
Note:
The OTLP receiver must be enabled before the OpenTelemetry Collector starts exporting metrics to Prometheus. Otherwise metric export requests to /api/v1/otlp will fail.
See further details about using Prometheus as OpenTelemetry metrics backend in the Prometheus documentation.
Elasticsearch exporter
One of the log pipelines is configured with an elasticsearch exporter pointing to the Elasticsearch cluster:
The elasticsearch exporter configuration includes the endpoint and the basicauth authenticator that references the credentials stored in environment variables.
extraEnvs:
  - name: ELASTIC_USER
    valueFrom:
      secretKeyRef:
        name: otel-elasticsearch-exporter-secret
        key: es-username
  - name: ELASTIC_PASSWORD
    valueFrom:
      secretKeyRef:
        name: otel-elasticsearch-exporter-secret
        key: es-password

config:
  extensions:
    basicauth:
      client_auth:
        username: "${env:ELASTIC_USER}"
        password: "${env:ELASTIC_PASSWORD}"
  exporters:
    elasticsearch:
      endpoint: http://efk-es-http.elastic:9200
      auth:
        authenticator: basicauth
  service:
    extensions:
      - health_check
      - basicauth
    pipelines:
      logs/elasticsearch:
        receivers: [otlp]
        processors: [memory_limiter, resource, batch]
        exporters: [elasticsearch]
Prerequisites: create Elasticsearch user and role
Before enabling the Elasticsearch exporter, create a dedicated Elasticsearch user and assign it a role with permissions for OpenTelemetry data streams.
In this setup, the collector uses:
- User:
otel - Role:
otel_role
The role must include at least:
- Cluster privilege:
monitor - Index patterns:
logs-*.otel-*,metrics-*.otel-*,traces-*.otel-* - Index privileges:
auto_configure,create_doc,create_index
Example role definition, which can be created through the Elasticsearch Security API:
{
  "cluster": ["monitor"],
  "indices": [
    {
      "names": ["logs-*.otel-*", "metrics-*.otel-*", "traces-*.otel-*"],
      "privileges": ["auto_configure", "create_doc", "create_index"]
    }
  ]
}
Example user definition, which can be created through the Elasticsearch Security API:
{
  "roles": ["otel_role"]
}
Equivalent curl commands using the Elasticsearch Security API:
export ES_URL="http://efk-es-http.elastic:9200"
export ES_ADMIN_USER="elastic"
export ES_ADMIN_PASSWORD="<elastic-admin-password>"
export OTEL_PASSWORD="<otel-password>"

curl -u "${ES_ADMIN_USER}:${ES_ADMIN_PASSWORD}" \
  -X PUT "${ES_URL}/_security/role/otel_role" \
  -H 'Content-Type: application/json' \
  -d '{
    "cluster": ["monitor"],
    "indices": [
      {
        "names": ["logs-*.otel-*", "metrics-*.otel-*", "traces-*.otel-*"],
        "privileges": ["auto_configure", "create_doc", "create_index"]
      }
    ]
  }'

curl -u "${ES_ADMIN_USER}:${ES_ADMIN_PASSWORD}" \
  -X POST "${ES_URL}/_security/user/otel" \
  -H 'Content-Type: application/json' \
  -d '{
    "password": "'"${OTEL_PASSWORD}"'"',
    "roles": ["otel_role"],
    "full_name": "OpenTelemetry Collector"
  }'
The username and password must then be stored in the secret backend used by the ExternalSecret, so the collector can authenticate to Elasticsearch through the basicauth extension.
The command to create the secret depends on the secret backend used. For example, if using Kubernetes secrets directly:
kubectl create secret generic otel-elasticsearch-exporter-secret \
  --namespace otel \
  --from-literal=es-username=otel \
  --from-literal=es-password="<otel-password>"
Default OTEL mapping mode
The Elasticsearch exporter uses the default otel mapping mode.
In this mode, documents are routed using the OpenTelemetry exporter dynamic data stream naming scheme:
${data_stream.type}-${data_stream.dataset}-${data_stream.namespace}
Where:
data_stream.typeislogsfor log records,metricsfor metric data points, andtracesfor spans.data_stream.datasetis automatically suffixed with.otel.data_stream.namespaceidentifies the logical namespace used for the target data stream.
As a result, OpenTelemetry data is stored using index patterns such as:
logs-*.otel-*metrics-*.otel-*traces-*.otel-*
See further details in the OpenTelemetry Elasticsearch exporter documentation.
Elasticsearch default OTEL templates
Elasticsearch provides built-in templates for OpenTelemetry data streams.
| Logs | Metrics | Traces | |
|---|---|---|---|
| Index Template | logs-otel@template |
metrics-otel@template |
traces-otel@template |
| Index Pattern | logs-*.otel-* |
metrics-*.otel-* |
traces-*.otel-* |
| ILM Policy | logs |
metrics |
traces |
These built-in templates allow OpenTelemetry documents to be indexed without forcing a static index name such as otel.
That is why the exporter configuration intentionally leaves logs_index unset.
ILM policy implications on single-node clusters
The built-in OpenTelemetry templates are associated with Elasticsearch lifecycle policies and default index settings.
For logs, the built-in template logs-otel@template uses the default lifecycle policy and does not set single-node-friendly shard and replica settings. When Elasticsearch creates indices with its default values, the result is typically:
number_of_shards: 1number_of_replicas: 1
In a single-node cluster, the replica shard cannot be allocated, so the cluster remains in YELLOW state.
In addition, the built-in lifecycle defaults do not provide the retention behavior normally expected for log data streams unless they are customized explicitly.
Customizing built-in OTEL templates
Elasticsearch allows customization of built-in templates by adding component templates such as logs@custom.
This is the recommended way to override default lifecycle and shard settings for OpenTelemetry data streams while keeping the built-in logs-otel@template, metrics-otel@template, and traces-otel@template structure.
Typical customizations are:
- set
number_of_replicas: 0for single-node clusters - set
number_of_shards: 1 - attach a custom ILM retention policy
See Elasticsearch documentation on customizing built-in ILM policies and templates.
Index template and ILM policy creation automation
Index templates and ILM policies should be created in advance so OpenTelemetry data streams are created with the desired lifecycle and index settings.
This cannot be automated by the OpenTelemetry Collector itself. It must be handled as a prerequisite in Elasticsearch.
Possible approaches are:
- Use scripts that create ILM policies and component templates through the Elasticsearch API.
- Use Terraform or OpenTofu automation to manage Elasticsearch roles, users, lifecycle policies and templates declaratively.
Example curl commands using the Elasticsearch API:
curl -u "${ES_ADMIN_USER}:${ES_ADMIN_PASSWORD}" \
  -X PUT "${ES_URL}/_ilm/policy/7-days-retention" \
  -H 'Content-Type: application/json' \
  -d '{
    "policy": {
      "phases": {
        "hot": {
          "min_age": "0ms",
          "actions": {
            "rollover": {
              "max_size": "10gb",
              "max_age": "7d"
            }
          }
        },
        "warm": {
          "min_age": "2d",
          "actions": {
            "shrink": {
              "number_of_shards": 1
            },
            "forcemerge": {
              "max_num_segments": 1
            }
          }
        },
        "delete": {
          "min_age": "7d",
          "actions": {
            "delete": {}
          }
        }
      }
    }
  }'

curl -u "${ES_ADMIN_USER}:${ES_ADMIN_PASSWORD}" \
  -X PUT "${ES_URL}/_component_template/logs@custom" \
  -H 'Content-Type: application/json' \
  -d '{
    "template": {
      "settings": {
        "index": {
          "lifecycle": {
            "name": "7-days-retention"
          },
          "number_of_shards": 1,
          "number_of_replicas": 0
        }
      }
    }
  }'
In this project, the final approach is to manage the required users, roles, ILM policies and component templates through OpenTofu-based Elastic configuration, including custom templates such as logs@custom to override the built-in OpenTelemetry defaults.
See the Terraform Elastic configuration documentation for details on how to manage Elasticsearch configuration through Terraform/OpenTofu.
Loki exporter
https://grafana.com/docs/loki/latest/send-data/otel/
Loki Prerequisites for OTLP ingestion
When logs are ingested by Loki using an OpenTelemetry protocol (OTLP) ingestion endpoint, some of the data is stored as Structured Metadata.
You must set allow_structured_metadata to true within your Loki config file. Otherwise, Loki will reject the log payload as malformed. Note that Structured Metadata is enabled by default in Loki 3.0 and later.
The following configuration snippet shows how to enable Structured Metadata in Loki Helm chart values:
loki:
  limits_config:
    allow_structured_metadata: true
The configuration above is required for Loki to accept OTLP log payloads because OTLP allows for arbitrary attributes that may not be indexed as labels.
allow_structured_metadata: truelets Loki persist non-indexed OTLP attributes as structured metadata.
By the other hand Loki should not index all OTLP resource attributes as labels. The default OTLP mapping can create too many active streams because attributes such as k8s.pod.name and service.instance.id are high cardinality.
OpenTelemetry format will be mapped by default to the Loki data model during ingestion, but the default OTLP mapping can create too many active streams because attributes such as k8s.pod.name and service.instance.id are high cardinality.
-
Index labels: Resource attributes map well to index labels in Loki, since both usually identify the source of the logs. The default list of Resource Attributes to store as Index labels can be configured using default_resource_attributes_as_index_labels.
-
Structured Metadata: OTLP attributes that are not indexed as labels can be stored as structured metadata in Loki. This allows you to keep all the information from the OTLP payload without overloading Loki with high-cardinality labels.
By default, the following resource attributes will be stored as index labels, while the remaining attributes are stored as Structured Metadata with each log entry:
cloud.availability_zone cloud.region container.name deployment.environment.name k8s.cluster.name k8s.container.name k8s.cronjob.name k8s.daemonset.name k8s.deployment.name k8s.job.name k8s.namespace.name k8s.pod.name k8s.replicaset.name k8s.statefulset.name service.instance.id service.name service.namespace
Warning: Because Loki has a default limit of 15 index labels, only a subset of resource attributes should be stored as index labels to avoid
maximum active stream limit exceedederrors. The default OTLP mapping includes many Kubernetes attributes that are high cardinality, such ask8s.pod.nameandservice.instance.id, which can easily lead to an explosion of active streams in Loki if indexed as labels. -
Timestamp: One of LogRecord.TimeUnixNano or LogRecord.ObservedTimestamp, based on which one is set. If both are not set, the ingestion timestamp will be used.
-
LogLine: LogRecord.Body holds the body of the log. However, since Loki only supports Log body in string format, we will stringify non-string values using the AsString method from the OTel collector lib.
-
Structured Metadata: Anything which can’t be stored in Index labels and LogLine would be stored as Structured Metadata. Here is a non-exhaustive list of what will be stored in Structured Metadata to give a sense of what it will hold:
Resource Attributes not stored as Index labels is replicated and stored with each log entry. Everything under InstrumentationScope is replicated and stored with each log entry. Everything under LogRecord except LogRecord.Body, LogRecord.TimeUnixNano and sometimes LogRecord.ObservedTimestamp.
Configuring Loki for OTLP ingestion
Loki can be configured to keep only a small set of stable attributes as index labels and store the rest as structured metadata:
loki:
  limits_config:
    otlp_config:
      resource_attributes:
        ignore_defaults: true
        attributes_config:
          - action: index_label
            attributes:
              - service.name
              - service.namespace
              - k8s.namespace.name
This configuration means:
ignore_defaults: truedisables Loki’s built-in default list of OTLP index labels.attributes_configwhitelists only low-cardinality resource attributes to be indexed.
This is the recommended setup for OTLP log ingestion in the cluster because it prevents maximum active stream limit exceeded errors while still keeping useful service and namespace labels available for LogQL queries.
See futher details in the Loki documentation on OTLP ingestion.
Configuring OTEL CollectorLogs pipeline with OTLP HTTP exporter to Loki
The second log pipeline exports logs to Loki using OTLP HTTP through the Loki gateway /otlp endpoint:
config:
  processors:
    transform/loki:
      log_statements:
        - context: log
          statements:
            - set(resource.attributes["exporter"], "OTLP")
            - set(resource.attributes["k8s.namespace.name"], log.attributes["k8s.namespace.name"])
            - delete_key(log.attributes, "k8s.namespace.name")
  exporters:
    otlphttp/loki:
      endpoint: http://loki-gateway.loki/otlp
  service:
    pipelines:
      logs/loki:
        receivers: [otlp]
        processors: [memory_limiter, resource, batch, transform/loki]
        exporters: [otlphttp/loki]
This pipeline uses the transform/loki processor to move k8s.namespace.name into resource attributes before export, because Loki OTLP label mapping is based on resource attributes.
On the Loki side, the cluster configuration keeps only low-cardinality resource attributes as index labels and stores the rest as structured metadata. This avoids the active-stream explosion caused by default OTLP label mappings such as k8s.pod.name or service.instance.id.
HTTPRoute exposure
OTLP HTTP Port (tcp 4319)is exposed defining a HTTPRoute attached to Envoy Gateway:
apiVersion: gateway.networking.k8s.io/v1
kind: HTTPRoute
metadata:
  name: otel-collector
spec:
  hostnames:
  - otel-collector.${CLUSTER_DOMAIN}
  parentRefs:
  - group: gateway.networking.k8s.io
    kind: Gateway
    name: public-gateway
    namespace: envoy-gateway-system
  rules:
  - backendRefs:
     - name: otel-collector
       port: 4318
    matches:
    - path:
        type: PathPrefix
        value: /
This exposes the collector through the shared Gateway API entry point already used by other platform services.
This allows browser-based telemetry clients (SPA applications) to send OTLP HTTP traffic to otel-collector.${CLUSTER_DOMAIN} and have it routed to the collector service.
Verification
After deployment, the collector can be validated with the following checks:
kubectl get pods -n otel
kubectl get svc -n otel
kubectl logs deployment/opentelemetry-collector -n otel
kubectl get httproute -n otel
Backends can then be verified independently:
- traces arriving in Tempo and visible in Grafana Explore
- metrics available in Prometheus through OTLP ingestion
- logs indexed in Elasticsearch and searchable in Kibana