Observability solution
Pi Cluster now uses a dual observability architecture.
Both architectures share the same visualization and storage backends, but they differ in how telemetry is collected and transported:
- An OpenTelemetry-based architecture, where instrumented workloads send logs, metrics and traces to the OpenTelemetry Collector using OTLP.
- A traditional collection architecture, where Prometheus scrapes metrics and Fluent Bit collects logs and forwards them through Fluentd.
This allows the cluster to support modern OTLP-native workloads while preserving the existing Prometheus and Fluent-based collection model used for cluster infrastructure, platform services and workloads that are not yet OpenTelemetry-instrumented.
Shared observability backends
Both collection paths feed the same observability platform:
- Grafana as the main visualization layer and correlation UI.
- Grafana Tempo as traces backend.
- Prometheus as metrics backend.
- Loki as log monitoring backend.
- Elasticsearch and Kibana as log analytics backend.
Grafana provides the single pane of glass for correlating metrics, traces and logs. Kibana complements that workflow when full-text search and deeper log analytics are required.
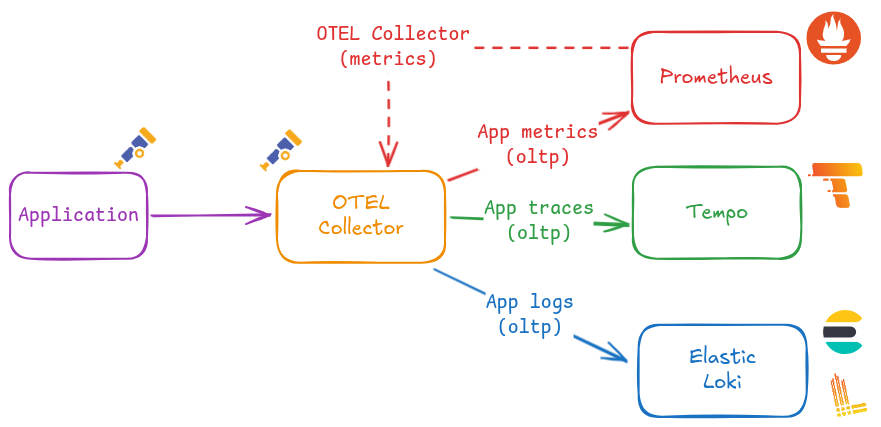
OpenTelemetry-based architecture
The OpenTelemetry architecture is intended for applications and platform components that emit telemetry using OpenTelemetry SDKs, auto-instrumentation agents, or native OTLP exporters.
In Pi Cluster, the OpenTelemetry Collector is already deployed from kubernetes/platform/opentelemetry-collector and wired into the production cluster through kubernetes/clusters/prod/infra/otel-collector-app.yaml.
The OpenTelemetry telemetry flow is:
- Applications generate OTLP logs, metrics and traces.
- The OpenTelemetry Collector receives and processes those signals.
- The collector exports each signal to the corresponding backend:
- Traces to Tempo.
- Metrics to Prometheus through the Prometheus OTLP HTTP ingestion endpoint.
- Logs to Elasticsearch.
- Grafana dashboards and Explore can correlate metrics and traces directly, while Elasticsearch and Kibana provide log analytics for OpenTelemetry log records.
This architecture is the preferred path for new application telemetry because it standardizes signal generation and centralizes signal processing in the collector.
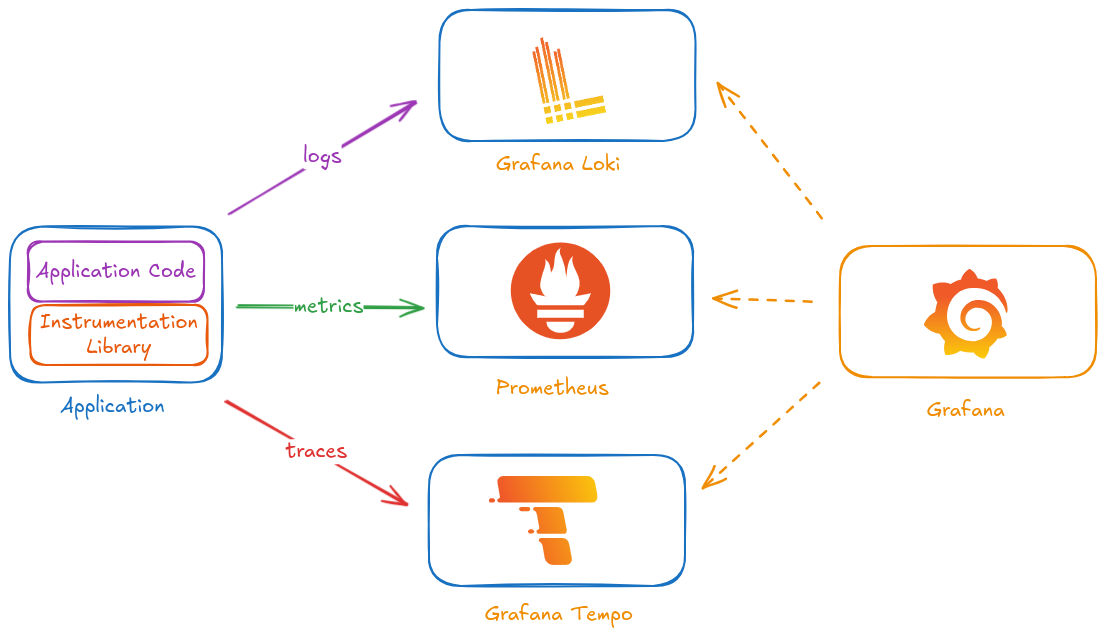
Traditional collection architecture
The traditional architecture remains active for cluster-level monitoring and for workloads that expose Prometheus metrics or write logs to files/stdout without OpenTelemetry instrumentation.
The traditional telemetry flow is:
- Prometheus collects metrics by scraping Kubernetes and application endpoints using
ServiceMonitor,PodMonitor,Probe, andScrapeConfigresources. - Fluent Bit runs on cluster nodes, collecting container, Kubernetes and host logs.
- Fluent Bit forwards logs to Fluentd.
- Fluentd aggregates, filters and routes logs to Loki for observability workflows and to Elasticsearch for analytics workflows.
- Grafana uses Prometheus, Loki and Tempo as data sources for dashboards and cross-signal navigation.
This path continues to be the main collection mechanism for infrastructure telemetry and for services that already integrate with Prometheus scraping and Fluent-based log shipping.
How both architectures coexist
The two architectures are complementary rather than mutually exclusive.
- OpenTelemetry path: best for application telemetry generated directly by instrumented services and components.
- Traditional path: best for infrastructure metrics, Kubernetes-native scraping targets, and logs collected from node or container runtime files.
In practice, Pi Cluster uses shared backends with multiple ingestion paths:
- Prometheus receives metrics from both scrape-based collection and OTLP ingestion via the OpenTelemetry Collector.
- Elasticsearch receives logs from both the OpenTelemetry Collector and the Fluent Bit/Fluentd pipeline.
- Loki continues to receive logs from the Fluent-based log pipeline.
- Tempo receives traces from the OpenTelemetry Collector.
This model allows an incremental migration toward OpenTelemetry without losing the existing Prometheus and Fluent-based operational workflows.
Observability solution installation procedure
The procedure for deploying the observability stack is described in the following pages:
- Shared backends and visualization
- Traditional collection architecture
- OpenTelemetry collection architecture