Kafka
Kafka Cluster installation
For the installation Strimzi kafka operator will be used to deploy a Kafka cluster.
Strimzi Operator installation procedure using Helm
Installation using Helm (Release 3):
-
Step 1: Add the Strimzi Helm repository:
helm repo add strimzi https://strimzi.io/charts/ -
Step2: Fetch the latest charts from the repository:
helm repo update -
Step 3: Create namespace
kubectl create namespace kafka -
Step 3: Install Strimzi kafka operator
helm install strimzi-kafka-operator strimzi/strimzi-kafka-operator --namespace kafka -
Step 4: Confirm that the deployment succeeded, run:
kubectl -n kafka get pod
Usage
Deploy Kafka cluster
Using Strimzi operator, Kafka cluster in KRaft mode can be deployed.
-
Step 1: Create a Kafka cluster of 3 nodes with dual roles (Kraft controller/ Kafka broker),configure its storage (5gb) and create a Kafka cluster from that pool broker using a specific Kafka release.
--- apiVersion: kafka.strimzi.io/v1 kind: KafkaNodePool metadata: name: dual-role labels: strimzi.io/cluster: cluster spec: replicas: 3 roles: - controller - broker storage: type: jbod volumes: - id: 0 type: persistent-claim size: 5Gi class: longhorn deleteClaim: false kraftMetadata: shared --- apiVersion: kafka.strimzi.io/v1 kind: Kafka metadata: name: cluster annotations: strimzi.io/node-pools: enabled strimzi.io/kraft: enabled spec: kafka: version: 4.1.1 metadataVersion: 4.1-IV1 listeners: - name: plain port: 9092 type: internal tls: false - name: tls port: 9093 type: internal tls: true config: offsets.topic.replication.factor: 3 transaction.state.log.replication.factor: 3 transaction.state.log.min.isr: 2 default.replication.factor: 3 min.insync.replicas: 2 entityOperator: topicOperator: {} userOperator: {} -
Step 2: Apply manifest
kubectl apply -f manifest.yml -
Step 3: Check Kafka status
kubectl get kafka -n kafka
NAME         DESIRED KAFKA REPLICAS   DESIRED ZK REPLICAS   READY   WARNINGS
my-cluster   3                        3                     True
Create Topic
-
Step 1: Create a manifest file
topic.yamlapiVersion: kafka.strimzi.io/v1 kind: KafkaTopic metadata: name: my-topic labels: strimzi.io/cluster: my-cluster spec: partitions: 1 replicas: 3 config: retention.ms: 7200000 segment.bytes: 1073741824 -
Step 2: Apply manifest
kubectl apply -f topic.yml -
Step 3: Check Kafka topic status
kubectl get kafkatopic my-topic -n kafka
NAME       CLUSTER      PARTITIONS   REPLICATION FACTOR   READY
my-topic   my-cluster   1            1                    True
Kafka Security Configuration
Strimzi, by default, uses encrypted TLS connections for internal communications between all components: Kafka Brokers, Kafka Controllers, Strimzi operator, Kafka Exporter, etc.
To secure connection between clients and Kafka brokers the following need to be configured:
- Encryption for data exchange
- Authentication to prove identity
- Authorization to allow or decline actions executed by users
Strimzi Operator Kubernetes resources (Kafka, KafkaUser) can be used to configure the mechanisms used for Kafka authentication and authorization.
Further details in Strimzi Documentation - Securing Access to Kafka
Enabling Encryption
Encryption between Kafka clients and Kafka Brokers can be enabled by setting Kafka.spec.kafka.listeners.tls property to true
The following Kafka resource define a Kafka Cluster with two different internal listeners in two different ports
plainlistener (TCP port 9092) without TLS (tls: false), using plain text communication between clients and brokers)tlslistener (TCP port 9093) with TLS enabled (tls: true), using TLS encrypted traffic between client and brokers.
apiVersion: kafka.strimzi.io/v1
kind: Kafka
metadata:
  name: cluster
  annotations:
    strimzi.io/node-pools: enabled
    strimzi.io/kraft: enabled
spec:
  kafka:
  # ...
    listeners:
      - name: plain
        port: 9092
        type: internal
        tls: false
      - name: tls
        port: 9093
        type: internal
        tls: true
...
Strimzi operator will generate corresponding TLS certificate for the brokers using its own CA.
Note: Internal Listeners
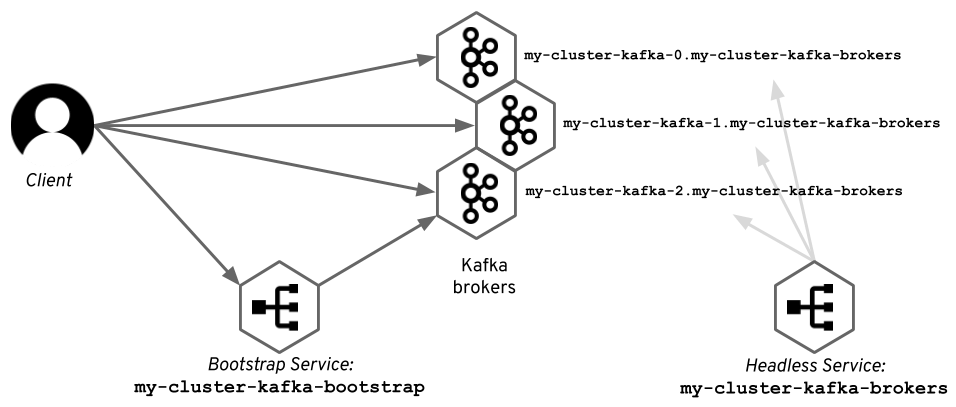
Internal listeners make accessible the kafka service to clients running in PODS within the Cluster
The internal listener type use a Kubernetes headless service and the DNS names given to the broker pods. It also generates a regular Kubernetes Service (bootstrap service) to connect to any of the Broker PODs to obtain the Kafka metadata.
In Kubernetes, clients uses Kafka Discovery Protocol to connect to proper Broker :
- The initial connection is done using a regular Kubernetes service (bootstrap service) to get the metadata.
- The subsequent connections are opened using the DNS names given to the pods by another headless Kubernetes service. The diagram below shows how does it look with an example Kafka cluster named
my-cluster.
 |
|---|
| Source: https://strimzi.io/blog/2019/04/17/accessing-kafka-part-1/ |
cluster-ip internal listener type can be used as an alternative to the headless Kubernetes service where Kafka is exposed using per-broker ClusterIP type services.
Enabling External Access
External listener can be configured to provide access to clients outside the Kubernetes Cluster
3 different types of external listeners (nodeport, loadbalancer, or ingress) can be configured depending on the Kubernetes external connection mechanism used to access the service.
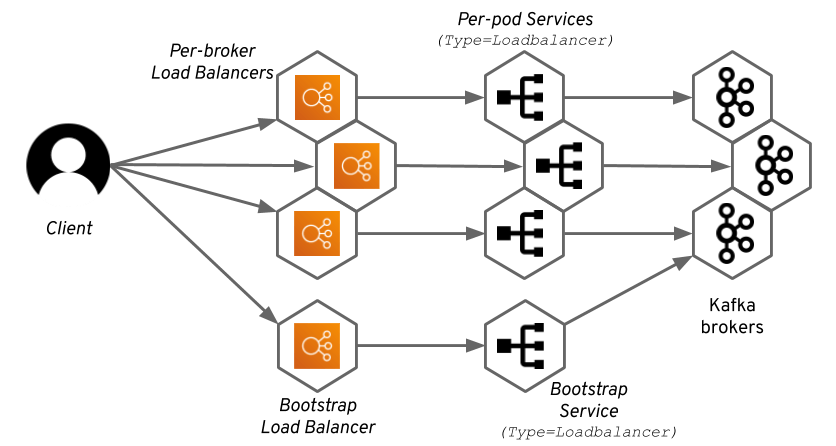
Load balancer
Strimzi operator generates a Kubernetes Service (type=LoadBalancer) for each broker. As a result, each broker will get a separate load balancer (despite the Kubernetes service being of a load balancer type, the load balancer is still a separate entity managed by the infrastructure / cloud, i.e: Cilium or MetalLB in case of self-hosted cluster). A Kafka cluster with N brokers will need N+1 load balancers.
 |
|---|
| Source: https://strimzi.io/blog/2019/05/13/accessing-kafka-part-4/ |
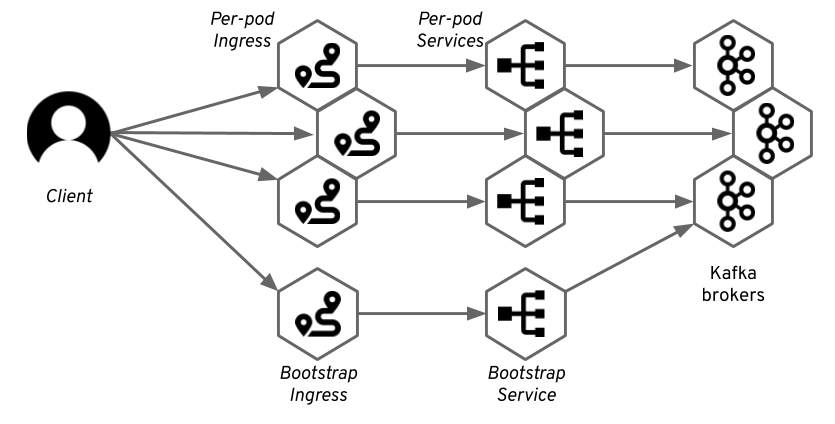
Ingress Listener
Strimzi operator generates a Kubernetes service as a bootstrap service and additional services (headless) for individual access to each of the Kafka brokers in the cluster. For each of these services, it also creates a Ingress resource with the corresponding TLS passthrough rule (Nginx Ingress resource annotation)
 |
|---|
| Source: https://strimzi.io/blog/2019/05/23/accessing-kafka-part-5/ |
Important: Requirements
Ingress listener only works if using NGINX Ingress Controller and when listener is configured with TLS enabled
NGINX Ingress Controller SSL Passthrough feature need to be enabled (disabled by default) (--enable-ssl-passthrough)
In case of deploying NGINX Ingress Controller using helm chart, add to values.yaml the following configuration
controller:
  extraArgs:
    enable-ssl-passthrough: true
The following will configure a ingress external listener. Ingress resources generated will be annotated with External-DNS annotations, so DNS records corresponding to each broker service and bootstrap service can be automatically created in the DNS.
 ...
listeners:
  # ...
  - name: external
    port: 9094
    type: ingress
    tls: true
    configuration:
      bootstrap:
        host: kafka-bootstrap.mydomain.com
        annotations:
          external-dns.alpha.kubernetes.io/hostname: kafka-bootstrap.mydomain.com.
          external-dns.alpha.kubernetes.io/ttl: "60"
      brokers:
      - broker: 0
        host: kafka-broker-0.mydomain.com
        annotations:
          external-dns.alpha.kubernetes.io/hostname: kafka-broker-0.mydomain.com.
          external-dns.alpha.kubernetes.io/ttl: "60"
      - broker: 1
        host: kafka-broker-1.mydomain.com
        annotations:
          external-dns.alpha.kubernetes.io/hostname: kafka-broker-1.mydomain.com.
          external-dns.alpha.kubernetes.io/ttl: "60"
      - broker: 2
        host: kafka-broker-2.mydomain.com
        annotations:
          external-dns.alpha.kubernetes.io/hostname: kafka-broker-2.mydomain.com.
          external-dns.alpha.kubernetes.io/ttl: "60"
      class: nginx
Using External TLS certificates
Instead of letting Strimzi create its own self-signed certificates, you can use your own Private CA (Private PKI) or even using certificates issued by a trusted CA like Let’s Encrypt. Cert-Manager can be used to create those certificates used by Kafka cluster, for the communications between clients and brokers.
For example, the following Certificate resource can be used to generate a single TLS certificate Kubernetes Secret (kafka-tls) valid for all DNS names (brokers and bootstrap)
apiVersion: cert-manager.io/v1
kind: Certificate
metadata:
  name: kafka-cert
spec:
  secretName: kafka-tls
  # Strimzi requires PKCS8 encoding for TLS certificates
  # The private key referenced in brokerCertChainAndKey must be in an unencrypted PKCS #8 format
  privateKey:
    encoding: PKCS8
  issuerRef:
    name: ca-issuer
    kind: ClusterIssuer
    group: cert-manager.io
  subject:
    organizations:
      - local.test
  dnsNames:
    - kafka-bootstrap.mydomain.com
    - kafka-broker-0.mydomain.com
    - kafka-broker-1.mydomain.com
    - kafka-broker-2.mydomain.com
The private key referenced in brokerCertChainAndKey must be in an unencrypted PKCS8 format.
When deploying Kafka resource spec.kafka.listener[].configuration.brokerCertChainAndKey property need to be provided, so external TLS certificate is used.
apiVersion: kafka.strimzi.io/v1
kind: Kafka
metadata:
  name: my-cluster
spec:
  kafka:
    listeners:
      #...
      - name: external
        port: 9094
        type: ingress
        tls: true
        configuration:
          # ...
          # Use External Certificate
          # ref: https://strimzi.io/docs/operators/latest/configuring.html#property-listener-config-brokerCertChainAndKey-reference
          brokerCertChainAndKey:
            secretName: kafka-tls
            certificate: tls.crt
            key: tls.key
Kafka Authentication
All type of listeners supports different authentication options:
- mTLS authentication (only on the listeners with TLS enabled encryption)
- SCRAM-SHA-512 authentication
- OAuth 2.0 token-based authentication
- Custom authentication
The listener authentication property (spec.kafka.listener[].authentication) is used to specify an authentication mechanism specific to that listener
If no authentication property is specified then the listener does not authenticate clients which connect through that listener. The listener will accept all connections without authentication.
The following example enables SCRAM-SHA-512 in port 9092 (plain communications) and mTLS in ports 9093 and 9094.
apiVersion: kafka.strimzi.io/v1
kind: Kafka
metadata:
  name: my-cluster
  namespace: myproject
spec:
  kafka:
    # ...
    listeners:
      - name: plain
        port: 9092
        type: internal
        tls: false
        authentication:
          type: scram-sha-512 # SCRAM authentication
      - name: tls
        port: 9093
        type: internal
        tls: true
        authentication:
         type: tls  # mTLS authentication
      - name: external
        port: 9094
        type: loadbalancer
        tls: true
        authentication:
          type: tls # mTLS authentication
Configuring SCRAM-SHA-512 authentication
SCRAM (Salted Challenge Response Authentication Mechanism) is an authentication protocol that can establish mutual authentication using passwords. Strimzi can configure Kafka to use SASL (Simple Authentication and Security Layer) SCRAM-SHA-512 to provide authentication on both unencrypted and encrypted client connections. When SCRAM-SHA-512 authentication is used with a TLS connection, the TLS protocol provides the encryption, but is not used for authentication.
The following properties of SCRAM make it safe to use SCRAM-SHA-512 even on unencrypted connections:
- The passwords are not sent in the clear over the communication channel. Instead the client and the server are each challenged by the other to offer proof that they know the password of the authenticating user.
- The server and client each generate a new challenge for each authentication exchange. This means that the exchange is resilient against replay attacks.
SCRAM authentication need to be configured at listener level (authentication)
# ...
spec:
  kafka:
    listeners:
      # ...
      - name: internal
        port: 9094
        type: ingress
        tls: false
        authentication:
          type: scram-sha-512
Authentication must be configured when using the User Operator to manage KafkaUsers.
When KafkaUser.spec.authentication.type is configured with scram-sha-512 the User Operator will generate a random 12-character password consisting of upper and lowercase ASCII letters and numbers.
For example the following creates a user producer
apiVersion: kafka.strimzi.io/v1
kind: KafkaUser
metadata:
  name: producer
  labels:
    strimzi.io/cluster: cluster
spec:
  authentication:
    type: scram-sha-512
Providing external Secrets for the passwords
Instead of letting Strimzi generate Secrets with autogenerated random passwords, Kubernetes secret can be provided instead
apiVersion: v1
kind: Secret
metadata:
  name: kafka-secrets
stringData:
  producer-password: "supers1cret0"
---
apiVersion: kafka.strimzi.io/v1
kind: KafkaUser
metadata:
  name: producer
  labels:
    strimzi.io/cluster: cluster
spec:
  authentication:
    type: scram-sha-512
    password:
      valueFrom:
        secretKeyRef:
          name: kafka-secrets
          key: producer-password
Configuring Kafka Authorization
Configure authorization for Kafka brokers using the Kafka.spec.kafka.authorization property in the Kafka resource. If the authorization property is missing, no authorization is enabled and clients have no restrictions. When enabled, authorization is applied to all enabled listeners. The authorization method is defined in the type field.
Supported authorization options:
- Simple authorization
- OAuth 2.0 authorization (if you are using OAuth 2.0 token based authentication)
- Open Policy Agent (OPA) authorization
- Custom authorization
Configuring Kafka ACL based authorization
Simple authorization in Strimzi uses the AclAuthorizer plugin, the default Access Control Lists (ACLs) authorization plugin provided with Apache Kafka. ACLs allow you to define which users have access to which resources at a granular level.
Configure authorization for Kafka brokers using the Kafka.spec.kafka.authorization property in the Kafka resource. If the authorization property is missing, no authorization is enabled and clients have no restrictions.
apiVersion: kafka.strimzi.io/v1
kind: Kafka
metadata:
  name: cluster
  annotations:
    strimzi.io/node-pools: enabled
    strimzi.io/kraft: enabled
spec:
  kafka:
    # ...
    listeners:
    #  ...
    authorization:
      type: simple # Authorization using ACLS
authorization.type indicates type of authorization (simple for Kafka ACLs). Strimzi supports other authorization mechanism like OAuth 2.0
ACL policies need to be configured within KafkaUser resource
For example the following creates two different users producer and consumer.
producerhaving read-write access totest-topicconsumerhaving read-access totest-topicand consume grouptest-consumer-group
---
apiVersion: kafka.strimzi.io/v1
kind: KafkaUser
metadata:
  name: producer
  labels:
    strimzi.io/cluster: cluster
spec:
  authentication:
    type: scram-sha-512
    password:
      valueFrom:
        secretKeyRef:
          name: kafka-secrets
          key: producer-password
  authorization:
    type: simple # Authorization using ACLS
    acls:
      - resource:
          type: topic
          name: test-topic
          patternType: literal
        operations:
          - Create
          - Describe
          - Write
        host: "*"
---
apiVersion: kafka.strimzi.io/v1
kind: KafkaUser
metadata:
  name: consumer
  labels:
    strimzi.io/cluster: cluster
spec:
  authentication:
    type: scram-sha-512
    password:
      valueFrom:
        secretKeyRef:
          name: kafka-secrets
          key: consumer-password
  authorization:
    type: simple # Authorization using ACLS
    acls:
      - resource:
          type: topic
          name: test-topic
          patternType: literal
        operations:
          - Describe
          - Read
        host: "*"
      - resource:
          type: group
          name: test-consumer-group
          patternType: literal
        operations:
          - Read
        host: "*"
Configuring superusers
Super users can access all resources in your Kafka cluster regardless of any access restrictions, and are supported by all authorization mechanisms.
For example in case of using ACL-based authorization, spec.kafka.authorization.superUsers property add list of super users in the format CN=<user-name>
apiVersion: kafka.strimzi.io/v1
kind: Kafka
metadata:
  name: my-cluster
  namespace: myproject
spec:
  kafka:
    # ...
    authorization:
      type: simple
      superUsers:
        - user1
Deploy Secure Kafka Cluster
Apply the following manifest files to create 3 Kafka cluter nodes (KRaft dual-mode) with the following configuration
- Authentication SCRAM-SHA-512 enabled
- Authorization using ACLs is configured
- External listener via Ingress Controller on port 909
- Using TLS certificate generated by Cert-Manager using Let’s Encrypt cluster issuer
- External DNS integration
- Super admin user
adminis created
---
apiVersion: cert-manager.io/v1
kind: Certificate
metadata:
  name: kafka-cert
  namespace: kafka
spec:
  dnsNames:
  - kafka-bootstrap.${CLUSTER_DOMAIN}
  - kafka-broker-0.${CLUSTER_DOMAIN}
  - kafka-broker-1.${CLUSTER_DOMAIN}
  - kafka-broker-2.${CLUSTER_DOMAIN}
  issuerRef:
    group: cert-manager.io
    kind: ClusterIssuer
    name: letsencrypt-issuer
  secretName: kafka-tls
  subject:
    organizations:
    - ${CLUSTER_DOMAIN}
---
apiVersion: kafka.strimzi.io/v1
kind: KafkaNodePool
metadata:
  labels:
    strimzi.io/cluster: cluster
  name: dual-role
  namespace: kafka
spec:
  replicas: 3
  roles:
  - controller
  - broker
  storage:
    type: jbod
    volumes:
    - deleteClaim: false
      id: 0
      kraftMetadata: shared
      size: 5Gi
      type: persistent-claim
---
apiVersion: kafka.strimzi.io/v1
kind: Kafka
metadata:
  name: cluster
  annotations:
    strimzi.io/node-pools: enabled
    strimzi.io/kraft: enabled
spec:
  kafka:
    version: 4.1.1
    metadataVersion: 4.1-IV1
    listeners:
      - name: plain # Plain listener for internal access
        port: 9092
        type: internal # headless service for internal access
        tls: false
        authentication:
          type: scram-sha-512 # Set authentication to scram-sha-512
      - name: tls  # TLS listerner for internal access
        port: 9093
        type: internal
        tls: true
        authentication:
          type: scram-sha-512 # Set authentication to scram-sha-512
        # Use External Certificate: https://strimzi.io/docs/operators/latest/configuring.html#property-listener-config-brokerCertChainAndKey-reference
        configuration:
          brokerCertChainAndKey:
            secretName: kafka-tls
            certificate: tls.crt
            key: tls.key
      - name: external # TLS listener for external access
        port: 9094
        type: ingress # Ingress Listener for external access
        tls: true
        authentication:
          type: scram-sha-512 # Set authentication to scram-sha-512
        configuration: # Configure Ingress resources created by Strimzi
          bootstrap:
            annotations:
              external-dns.alpha.kubernetes.io/hostname: kafka-bootstrap.${CLUSTER_DOMAIN}.
              external-dns.alpha.kubernetes.io/ttl: "60"
            host: kafka-bootstrap.${CLUSTER_DOMAIN}
          brokers:
            - broker: 0
              annotations:
                external-dns.alpha.kubernetes.io/hostname: kafa-broker-0.${CLUSTER_DOMAIN}.
                external-dns.alpha.kubernetes.io/ttl: "60"
              host: kafka-broker-0.${CLUSTER_DOMAIN}
            - broker: 1
              annotations:
                external-dns.alpha.kubernetes.io/hostname: kafka-broker-1.${CLUSTER_DOMAIN}.
                external-dns.alpha.kubernetes.io/ttl: "60"
              host: kafka-broker-1.${CLUSTER_DOMAIN}
            - broker: 2
              annotations:
                external-dns.alpha.kubernetes.io/hostname: broker-2.${CLUSTER_DOMAIN}.
                external-dns.alpha.kubernetes.io/ttl: "60"
              host: kafka-broker-2.${CLUSTER_DOMAIN}
          # Use External Certificate
          brokerCertChainAndKey:
            secretName: kafka-tls
            certificate: tls.crt
            key: tls.key
          class: nginx
    authorization:
      type: simple # Authorization using ACLS
      # super user
      superUsers:
        - admin # Matches the KafkaUser metadata.name
    config:
      offsets.topic.replication.factor: 3
      transaction.state.log.replication.factor: 3
      transaction.state.log.min.isr: 2
      default.replication.factor: 3
      min.insync.replicas: 2
  entityOperator:
    topicOperator: {}
    userOperator: {}
---
apiVersion: v1
kind: Secret
metadata:
  name: kafka-admin-secret
  namespace: kafka
stringData:
  password: "supersupers1cret0"
---
apiVersion: kafka.strimzi.io/v1beta1
kind: KafkaUser
metadata:
  name: admin
  namespace: kafka
  labels:
    strimzi.io/cluster: cluster
spec:
  authentication:
    type: scram-sha-512
    password:
      valueFrom:
        secretKeyRef:
          name: kafka-admin-secret
          key: password
Note:
Substitute variables (${var}) in the above yaml file before deploying helm chart.
- Replace
${CLUSTER_DOMAIN}by the domain name used in the cluster. For example:homelab.ricsanfre.comFQDN must be mapped, in cluster DNS server configuration, to NGINX Ingress Controller’s Load Balancer service external IP. External-DNS can be configured to automatically add that entry in your DNS service.
Testing Kafka cluster
Configure Kafka Topics and Users
Apply the following manifets to:
- Create
test-topicKafka topic - Create
producerandconsumerKafka clients and assign the proper ACLs to access Kafka resources
# Kafka Topic
---
apiVersion: kafka.strimzi.io/v1
kind: KafkaTopic
metadata:
  name: test-topic
  namespace: kafka
  labels:
    strimzi.io/cluster: cluster
spec:
  partitions: 1
  replicas: 3
  config:
    retention.ms: 7200000
    segment.bytes: 1073741824
# Kafka Users
---
apiVersion: kafka.strimzi.io/v1
kind: KafkaUser
metadata:
  name: producer
  labels:
    strimzi.io/cluster: cluster
  namespace: kafka
spec:
  authentication:
    type: scram-sha-512
    password:
      valueFrom:
        secretKeyRef:
          name: kafka-secrets
          key: producer-password
  authorization:
    type: simple # Authorization using ACLS
    acls:
      - resource:
          type: topic
          name: test-topic
          patternType: literal
        operations:
          - Create
          - Describe
          - Write
        host: "*"
---
apiVersion: kafka.strimzi.io/v1
kind: KafkaUser
metadata:
  name: consumer
  namespace: kafka
  labels:
    strimzi.io/cluster: cluster
spec:
  authentication:
    type: scram-sha-512
    password:
      valueFrom:
        secretKeyRef:
          name: kafka-secrets
          key: consumer-password
  authorization:
    type: simple # Authorization using ACLS
    acls:
      - resource:
          type: topic
          name: test-topic
          patternType: literal
        operations:
          - Describe
          - Read
        host: "*"
      - resource:
          type: group
          name: test-consumer-group
          patternType: literal
        operations:
          - Read
        host: "*"
Testing Internal clients
Testing kafka clients running as PODS within the Kubernetes cluster. In this case PLAIN port can be used in the communications and only SCRAM/SASL authentication has to be configured.
Built-in kafka-console-producer and kafka-console-consumer CLI commands can be used to send plain messages to a Kafka topic.
-
Step 1: Create kafka properties fields for producer and cosumer containing SCRAM/SASL credentials
producer_plain.propertiessecurity.protocol=SASL_PLAINTEXT sasl.mechanism=SCRAM-SHA-512 sasl.jaas.config=org.apache.kafka.common.security.scram.ScramLoginModule required username=producer password=supers1cret0consumer_plain.propertiessecurity.protocol=SASL_PLAINTEXT sasl.mechanism=SCRAM-SHA-512 sasl.jaas.config=org.apache.kafka.common.security.scram.ScramLoginModule required username="consumer" password="s1cret0" -
Step 2: Create POD using kafka image and copy the properties fiels
kubectl run kafka-clients --restart='Never' --image quay.io/strimzi/kafka:0.49.0-kafka-4.1.1 --namespace kafka --command -- sleep infinity kubectl cp producer_plain.properties kafka/kafka-clients:/tmp/producer.properties kubectl cp consumer_plain.properties kafka/kafka-clients:/tmp/consumer.properties -
Step 3: Launch Producer (
kafka-console-producer.sh)kubectl exec -it kafka-clients --namespace kafka -- bin/kafka-console-producer.sh \ --producer.config /tmp/producer.properties \ --bootstrap-server cluster-kafka-bootstrap:9092 \ --topic test-topic -
Step 4: Launch Consumer (
kafka-console-consumer.sh), in a different terminalkubectl exec -it kafka-clients --namespace kafka -- bin/kafka-console-consumer.sh \ --consumer.config /tmp/consumer.properties \ --bootstrap-server cluster-kafka-bootstrap:9092 \ --topic test-topic \ --group test-consumer-group --from-beginning -
Step 5: In producer terminal wait for the prompt and start typing messages. (Input Control-C to finish)
Messages will be outputed in consumer terminal.
Testing External clients
Testing Kafka clients running outside the cluster using exposed Kafka listener in port TCP 9092 which is secured using TLS.
-
Step 1: (Optional Step) Extract CA certificate used by Kafka Brokers. Only needed in case that Cluster certificate is not provided by Let’s Encript but a private PKI.
kubectl get secret root-secret -n cert-manager -o jsonpath='{.data.tls\.crt}' | base64 --decode > certs/ca.crt
  kubectl get secret root-secret -n cert-manager -o jsonpath='{.data.tls\.key}' | base64 --decode > certs/ca.key
In the sample above, it is assumed that Kafka Certificate has been created using the Self-signed
ClusterIssueras described in Cert-Manager Documentation: Private PKI. In this caseroot-secretcontains CA certificate and key used to Bootstrap Private PKI with Cert-Manager. -
Step 2: Create kafka properties fields for producer and cosumer containing SCRAM/SASL credentials. In this case
security.protocolshould beSASL_SSLinstead ofSASL_PLAINTEXTproperties/producer_ssl.propertiessecurity.protocol=SASL_SSL sasl.mechanism=SCRAM-SHA-512 sasl.jaas.config=org.apache.kafka.common.security.scram.ScramLoginModule required username=producer password=supers1cret0properties/consumer_ssl.propertiessecurity.protocol=SASL_SSL sasl.mechanism=SCRAM-SHA-512 sasl.jaas.config=org.apache.kafka.common.security.scram.ScramLoginModule required username="consumer" password="s1cret0"If Kafka TLS certificate has been signed by custom CA, instead of using Let’s Encrypt certificates the following options need to be added to the properties files. So trustore containing CA certificate is used.
ssl.truststore.location=/tmp/truststore.jks ssl.truststore.password=supers1cret0 -
Step 3: Create docker container with Kafka clients (
kafka-console-consumerandkafka-console-producer) such as the one provided by Strimziservices: kafka-client: image: quay.io/strimzi/kafka:0.49.0-kafka-4.1.1 container_name: kafka-client volumes: - ./properties:/tmp/properties - ./certs:/tmp/certs restart: unless-stopped command: - sh - -c - while [ true ]; do sleep 30; done; # If using private CA issuer, use this command instead # command: # - sh # - -c # - | # keytool -import -trustcacerts -alias root -file /tmp/certs/ca.crt -keystore /tmp/truststore.jks -storepass supers1cret0 -noprompt && # while [ true ]; do sleep 30; done; -
Step 4 (Optional, not Let’s Encrypt certificate): Add CA certificate to trusted store
If custom CA is used instead of Let’s encryp. First command to be executed is to import CA certificate into trustore
docker exec -it kafka-client \ keytool -import -trustcacerts -alias root -file /tmp/certs/ca.crt -keystore /tmp/truststore.jks -storepass supers1cret0 -nopromp -
Step 5: Launch Producer
export KAFKA_REMOTE_BOOTSTRAP=kafka-bootstrap.yourdomain.comdocker exec -it kafka-client bin/kafka-console-producer.sh \ --producer.config /tmp/properties/producer_ssl.properties \ --bootstrap-server ${KAFKA_REMOTE_BOOTSTRAP}:443 \ --topic test-topic -
Step 5: Launch Consumer in another terminal
docker exec -it kafka-client bin/kafka-console-consumer.sh \
--consumer.config /tmp/properties/consumer_ssl.properties \
--bootstrap-server ${KAFKA_REMOTE_BOOTSTRAP}:443 \
--topic test-topic \
--group test-consumer-group --from-beginning
Observability
Metrics
Kafka can be configured to generate Prometheus metrics using an external exporters (Prometheus JMX Exporter and Kafka Exporter).
Prometheus JMX Exporter
Prometheus JMX Exporter is a collector of JMX metrics and exposes them via HTTP for Prometheus consumption.
Kafka generates JMX metrics that can be collected by Prometheus JMX Exporter. The JMX Exporter runs as a Java agent within the Kafka broker process, exposing JMX metrics on an HTTP endpoint.
Prometheus Kafka Exporter
Kafka exposed metrics via JMX are not sufficient to monitor Kafka brokers and clients.
Kafka Exporter is an open source project to enhance monitoring of Apache Kafka brokers and clients. It collects and exposes additional metrics related to Kafka consumer groups, consumer lags, topics, partitions, and offsets.
Strimzi Operator
Strimzi provides built-in support for JMX Exporter and Kafka Exporter.
When creating Kafka Cluster using Strimzi Operator, JMX Exporter and Kafka Exporter can be enabled by adding the following configuration to the Kafka manifest file:
apiVersion: kafka.strimzi.io/v1
kind: Kafka
metadata:
  name: cluster
spec:
  kafka:
    # ...
    # Configure JMX Exporter
    metricsConfig:
      type: jmxPrometheusExporter
      valueFrom:
        configMapKeyRef:
          name: kafka-metrics
          key: kafka-metrics-config.yml
  # Enable Kafka Exporter
  kafkaExporter:
    topicRegex: ".*"
    groupRegex: ".*"
Prometheus JMX Exporter configuration file must be provided in a ConfigMap named kafka-metrics in the same namespace as the Kafka cluster.
This files contains rules for mapping JMX metrics to Prometheus metrics. The following is a sample confguration provided by Strimzi that can be used as a starting point:
kind: ConfigMap
apiVersion: v1
metadata:
  name: kafka-metrics
  labels:
    app: strimzi
data:
  kafka-metrics-config.yml: |
    # See https://github.com/prometheus/jmx_exporter for more info about JMX Prometheus Exporter metrics
    lowercaseOutputName: true
    rules:
    # Special cases and very specific rules
    - pattern: kafka.server<type=(.+), name=(.+), clientId=(.+), topic=(.+), partition=(.*)><>Value
      name: kafka_server_$1_$2
      type: GAUGE
      labels:
        clientId: "$3"
        topic: "$4"
        partition: "$5"
    - pattern: kafka.server<type=(.+), name=(.+), clientId=(.+), brokerHost=(.+), brokerPort=(.+)><>Value
      name: kafka_server_$1_$2
      type: GAUGE
      labels:
        clientId: "$3"
        broker: "$4:$5"
    - pattern: kafka.server<type=(.+), cipher=(.+), protocol=(.+), listener=(.+), networkProcessor=(.+)><>connections
      name: kafka_server_$1_connections_tls_info
      type: GAUGE
      labels:
        cipher: "$2"
        protocol: "$3"
        listener: "$4"
        networkProcessor: "$5"
    - pattern: kafka.server<type=(.+), clientSoftwareName=(.+), clientSoftwareVersion=(.+), listener=(.+), networkProcessor=(.+)><>connections
      name: kafka_server_$1_connections_software
      type: GAUGE
      labels:
        clientSoftwareName: "$2"
        clientSoftwareVersion: "$3"
        listener: "$4"
        networkProcessor: "$5"
    - pattern: "kafka.server<type=(.+), listener=(.+), networkProcessor=(.+)><>(.+-total):"
      name: kafka_server_$1_$4
      type: COUNTER
      labels:
        listener: "$2"
        networkProcessor: "$3"
    - pattern: "kafka.server<type=(.+), listener=(.+), networkProcessor=(.+)><>(.+):"
      name: kafka_server_$1_$4
      type: GAUGE
      labels:
        listener: "$2"
        networkProcessor: "$3"
    - pattern: kafka.server<type=(.+), listener=(.+), networkProcessor=(.+)><>(.+-total)
      name: kafka_server_$1_$4
      type: COUNTER
      labels:
        listener: "$2"
        networkProcessor: "$3"
    - pattern: kafka.server<type=(.+), listener=(.+), networkProcessor=(.+)><>(.+)
      name: kafka_server_$1_$4
      type: GAUGE
      labels:
        listener: "$2"
        networkProcessor: "$3"
    # Some percent metrics use MeanRate attribute
    # Ex) kafka.server<type=(KafkaRequestHandlerPool), name=(RequestHandlerAvgIdlePercent)><>MeanRate
    - pattern: kafka.(\w+)<type=(.+), name=(.+)Percent\w*><>MeanRate
      name: kafka_$1_$2_$3_percent
      type: GAUGE
    # Generic gauges for percents
    - pattern: kafka.(\w+)<type=(.+), name=(.+)Percent\w*><>Value
      name: kafka_$1_$2_$3_percent
      type: GAUGE
    - pattern: kafka.(\w+)<type=(.+), name=(.+)Percent\w*, (.+)=(.+)><>Value
      name: kafka_$1_$2_$3_percent
      type: GAUGE
      labels:
        "$4": "$5"
    # Generic per-second counters with 0-2 key/value pairs
    - pattern: kafka.(\w+)<type=(.+), name=(.+)PerSec\w*, (.+)=(.+), (.+)=(.+)><>Count
      name: kafka_$1_$2_$3_total
      type: COUNTER
      labels:
        "$4": "$5"
        "$6": "$7"
    - pattern: kafka.(\w+)<type=(.+), name=(.+)PerSec\w*, (.+)=(.+)><>Count
      name: kafka_$1_$2_$3_total
      type: COUNTER
      labels:
        "$4": "$5"
    - pattern: kafka.(\w+)<type=(.+), name=(.+)PerSec\w*><>Count
      name: kafka_$1_$2_$3_total
      type: COUNTER
    # Generic gauges with 0-2 key/value pairs
    - pattern: kafka.(\w+)<type=(.+), name=(.+), (.+)=(.+), (.+)=(.+)><>Value
      name: kafka_$1_$2_$3
      type: GAUGE
      labels:
        "$4": "$5"
        "$6": "$7"
    - pattern: kafka.(\w+)<type=(.+), name=(.+), (.+)=(.+)><>Value
      name: kafka_$1_$2_$3
      type: GAUGE
      labels:
        "$4": "$5"
    - pattern: kafka.(\w+)<type=(.+), name=(.+)><>Value
      name: kafka_$1_$2_$3
      type: GAUGE
    # Emulate Prometheus 'Summary' metrics for the exported 'Histogram's.
    # Note that these are missing the '_sum' metric!
    - pattern: kafka.(\w+)<type=(.+), name=(.+), (.+)=(.+), (.+)=(.+)><>Count
      name: kafka_$1_$2_$3_count
      type: COUNTER
      labels:
        "$4": "$5"
        "$6": "$7"
    - pattern: kafka.(\w+)<type=(.+), name=(.+), (.+)=(.*), (.+)=(.+)><>(\d+)thPercentile
      name: kafka_$1_$2_$3
      type: GAUGE
      labels:
        "$4": "$5"
        "$6": "$7"
        quantile: "0.$8"
    - pattern: kafka.(\w+)<type=(.+), name=(.+), (.+)=(.+)><>Count
      name: kafka_$1_$2_$3_count
      type: COUNTER
      labels:
        "$4": "$5"
    - pattern: kafka.(\w+)<type=(.+), name=(.+), (.+)=(.*)><>(\d+)thPercentile
      name: kafka_$1_$2_$3
      type: GAUGE
      labels:
        "$4": "$5"
        quantile: "0.$6"
    - pattern: kafka.(\w+)<type=(.+), name=(.+)><>Count
      name: kafka_$1_$2_$3_count
      type: COUNTER
    - pattern: kafka.(\w+)<type=(.+), name=(.+)><>(\d+)thPercentile
      name: kafka_$1_$2_$3
      type: GAUGE
      labels:
        quantile: "0.$4"
    # KRaft overall related metrics
    # distinguish between always increasing COUNTER (total and max) and variable GAUGE (all others) metrics
    - pattern: "kafka.server<type=raft-metrics><>(.+-total|.+-max):"
      name: kafka_server_raftmetrics_$1
      type: COUNTER
    - pattern: "kafka.server<type=raft-metrics><>(current-state): (.+)"
      name: kafka_server_raftmetrics_$1
      value: 1
      type: UNTYPED
      labels:
        $1: "$2"
    - pattern: "kafka.server<type=raft-metrics><>(.+):"
      name: kafka_server_raftmetrics_$1
      type: GAUGE
    # KRaft "low level" channels related metrics
    # distinguish between always increasing COUNTER (total and max) and variable GAUGE (all others) metrics
    - pattern: "kafka.server<type=raft-channel-metrics><>(.+-total|.+-max):"
      name: kafka_server_raftchannelmetrics_$1
      type: COUNTER
    - pattern: "kafka.server<type=raft-channel-metrics><>(.+):"
      name: kafka_server_raftchannelmetrics_$1
      type: GAUGE
    # Broker metrics related to fetching metadata topic records in KRaft mode
    - pattern: "kafka.server<type=broker-metadata-metrics><>(.+):"
      name: kafka_server_brokermetadatametrics_$1
      type: GAUGE
Once the Kafka cluster is deployed with JMX Exporter and Kafka Exporter enabled, Prometheus can be configured to scrape metrics from the exporters.
If Kube-Prometheus-Stack is installed in the cluster, Prometheus can be configured to scrape metrics from Kafka brokers and exporters by creating a PodMonitor resources.
The following resources can be created for scraping metrics from all PODs that are created by Strimzi (Kafka, KafkaConnect, KafkaMirrorMaker) are created in the Kafka namespace:
apiVersion: monitoring.coreos.com/v1
kind: PodMonitor
metadata:
  name: cluster-operator-metrics
  labels:
    app: strimzi
spec:
  selector:
    matchLabels:
      strimzi.io/kind: cluster-operator
  namespaceSelector:
    matchNames:
      - kafka
  podMetricsEndpoints:
  - path: /metrics
    port: http
---
apiVersion: monitoring.coreos.com/v1
kind: PodMonitor
metadata:
  name: entity-operator-metrics
  labels:
    app: strimzi
spec:
  selector:
    matchLabels:
      app.kubernetes.io/name: entity-operator
  namespaceSelector:
    matchNames:
      - kafka
  podMetricsEndpoints:
  - path: /metrics
    port: healthcheck
---
apiVersion: monitoring.coreos.com/v1
kind: PodMonitor
metadata:
  name: bridge-metrics
  labels:
    app: strimzi
spec:
  selector:
    matchLabels:
      strimzi.io/kind: KafkaBridge
  namespaceSelector:
    matchNames:
      - kafka
  podMetricsEndpoints:
  - path: /metrics
    port: rest-api
---
apiVersion: monitoring.coreos.com/v1
kind: PodMonitor
metadata:
  name: kafka-resources-metrics
  labels:
    app: strimzi
spec:
  selector:
    matchExpressions:
      - key: "strimzi.io/kind"
        operator: In
        values: ["Kafka", "KafkaConnect", "KafkaMirrorMaker2"]
  namespaceSelector:
    matchNames:
      - kafka
  podMetricsEndpoints:
  - path: /metrics
    port: tcp-prometheus
    relabelings:
    - separator: ;
      regex: __meta_kubernetes_pod_label_(strimzi_io_.+)
      replacement: $1
      action: labelmap
    - sourceLabels: [__meta_kubernetes_namespace]
      separator: ;
      regex: (.*)
      targetLabel: namespace
      replacement: $1
      action: replace
    - sourceLabels: [__meta_kubernetes_pod_name]
      separator: ;
      regex: (.*)
      targetLabel: kubernetes_pod_name
      replacement: $1
      action: replace
    - sourceLabels: [__meta_kubernetes_pod_node_name]
      separator: ;
      regex: (.*)
      targetLabel: node_name
      replacement: $1
      action: replace
    - sourceLabels: [__meta_kubernetes_pod_host_ip]
      separator: ;
      regex: (.*)
      targetLabel: node_ip
      replacement: $1
      action: replace
Note:
Further details can be found in Strimzi documentation - Monitoring Kafka See samples file configuration in Strimzi operator GitHub repo - Examples: Metrics
Grafana Dashboards
If Grafana’s dynamic provisioning of dashboard is configured, Kafka grafana dashboard is automatically deployed by Strimzi Operator Helm chart when providing the following values:
dashboards:
  enabled: true
  label: grafana_dashboard # this is the default value from the grafana chart
  labelValue: "1" # this is the default value from the grafana chart
  # Annotations to specify the Grafana folder
  annotations:
    grafana_folder: Strimzi
  extraLabels: {}
Helm chart will deploy a dahsboard in a kubernetes ConfigMap that Grafana can dynamically load and add into “Strimzi” folder.
Schema Registry
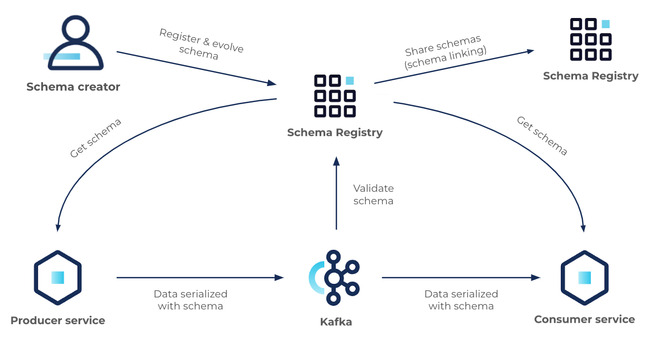
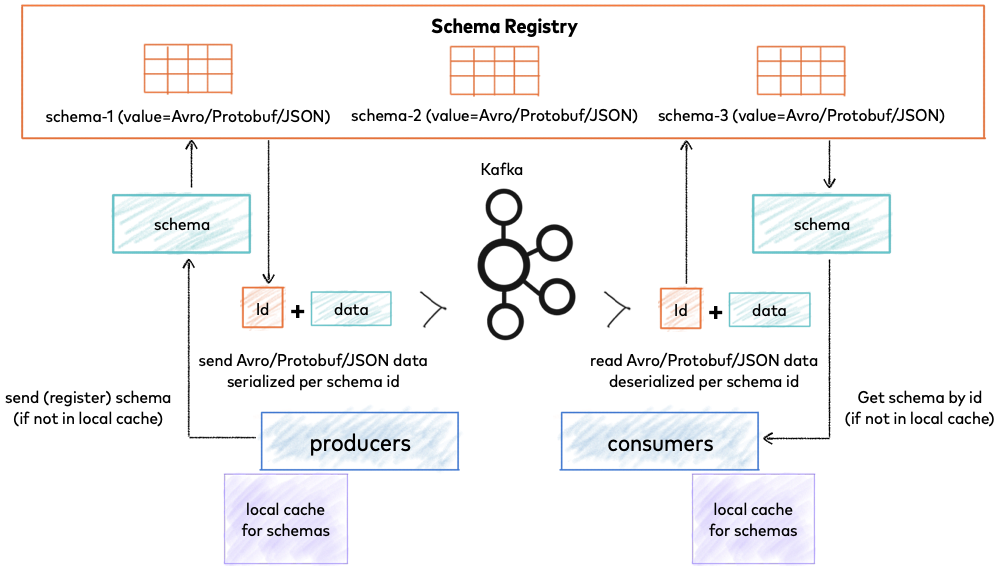
A schema defines the structure of message data. It defines allowed data types, their format, and relationships. A schema acts as a blueprint for data, describing the structure of data records, the data types of individual fields, the relationships between fields, and any constraints or rules that apply to the data.
Kafka Schema Registry is a component in the Apache Kafka ecosystem that provides a centralized schema management service for Kafka producers and consumers. It allows producers to register schemas for the data they produce, and consumers to retrieve and use these schemas for data validation and deserialization. The Schema Registry helps ensure that data exchanged through Kafka is compliant with a predefined schema, enabling data consistency, compatibility, and evolution across different systems and applications.
 |
|---|
| Source: https://docs.confluent.io/platform/current/schema-registry/index.html |
 |
|---|
| Source: https://docs.confluent.io/platform/current/schema-registry/fundamentals/index.html |
When using Avro or other schema format, it is critical to manage schemas and evolve them thoughtfully. Schema compatibility checking is enabled in Kafka Schema Registry by versioning every single schema and comparing new schemas to previous versions. The type of compatibility required (backward, forward, full, none, etc) determines how Kafka Schema Registry evaluates each new schema. New schemas that fail compatibility checks are removed from service.
Some key benefits of using Kafka Schema Registry include:
-
Schema Evolution: As data formats and requirements evolve over time, it is common for producers and consumers to undergo changes to their data schemas. Kafka Schema Registry provides support for schema evolution, allowing producers to register new versions of schemas while maintaining compatibility with existing consumers. Consumers can retrieve the appropriate schema version for deserialization, ensuring that data is processed correctly even when schema changes occur.
-
Data Validation: Kafka Schema Registry enables data validation by allowing producers to register schemas with predefined data types, field names, and other constraints. Consumers can then retrieve and use these schemas to validate incoming data, ensuring that data conforms to the expected structure and format. This helps prevent data processing errors and improves data quality. Schema Management: Kafka Schema Registry provides a centralized repository for managing schemas, making it easier to track, version, and manage changes. Producers and consumers can register, retrieve and manage schemas through a simple API, allowing for centralized schema governance and management.
-
Interoperability: Kafka Schema Registry promotes interoperability between different producers and consumers by providing a standardized way to define and manage data schemas. Producers and consumers written in different programming languages or using different serialization frameworks can use a common schema registry to ensure data consistency and compatibility across the ecosystem.
-
Backward and Forward Compatibility: Kafka Schema Registry allows producers to register backward and forward compatible schemas, enabling smooth upgrades and changes to data schemas without disrupting existing producers and consumers. Backward compatibility ensures that older consumers can still process data produced with a newer schema, while forward compatibility allows newer consumers to process data produced with an older schema.
Deploying Schema Registry using Helm Chart
Official confluent docker images for Schema Registry can be installed using helm chart maintained by the community. Confluent official docker images support multiarchitecture (x86/ARM). However, this helm chart is quite old and it seems not to be maintaned any more (last update: 2 years ago).
By the other hand, Bitnami maintains a Helm Chart to deploy Schema Registry, Bitnami Confluent Schema Registry which is keept up to date and supports and it ,supports multi-architecture docker images.
In July 225 Bitnami announced the removal of its Docker Public Catalog which makes the option of using Bitnami’s Helm not feasible. Access to updated Docker images won’t be available for free anymore.
As alternative a packaged kustomize application will be used to deploy Schema Registry using Confluent’s docker images.
Kustomize Schema Registry application
The application can be defined using the following directory structure
└── schema-registry
    ├── base
    │   ├── deployment.yaml
    │   ├── service.yaml
    │   ├── service-account.yaml
    │   ├── ingress.yaml
    │   ├── kafka-secrets.yaml
    │   ├── kafka-topic.yaml
    │   ├── kafka-user.yaml
    │   └── kustomization.yaml
    └── overlays
        ├── dev
        │   └── kustomization.yaml
        └── prod
            └── kustomization.yaml
-
Prepare files for enabling REST API security using HTTP Basic Auth
base/registry-jaas.confSchemaRegistry-Props { org.eclipse.jetty.jaas.spi.PropertyFileLoginModule required file="/etc/auth/passwords" debug="true"; }; -
Kustomization base file
base/kustomization.yamlapiVersion: kustomize.config.k8s.io/v1beta1 kind: Kustomization resources: - service-account.yaml - deployment.yaml - service.yaml - ingress.yaml - kafka-topic.yaml - kafka-user.yaml configMapGenerator: - name: schema-registry-jaas files: - registry-jaas.conf=registry-jaas.confKustomization file creates cm
schema-registry-jaasfrom registry-jaas-conf file -
Secrets (Kafka Credentias/JAAS Config and REST API passwords file)
base\kafka-secrets.yaml--- apiVersion: v1 kind: Secret metadata: name: schema-registry-kafka-secret stringData: username: schema-registry password: supers1cret0 --- apiVersion: v1 kind: Secret metadata: name: schema-registry-jaas-config stringData: plain-jaas.conf: | org.apache.kafka.common.security.scram.ScramLoginModule required username=schema-registry password=supers1cret0; --- apiVersion: v1 kind: Secret metadata: name: schema-registry-passwords stringData: passwords: | kafdrop: supers1creto, user, developer probe: s1cret0, user, developer client: s1cret0, user, developer -
Kafka configuration: Topic, User.
base\kafka-topic.yamlapiVersion: kafka.strimzi.io/v1 kind: KafkaTopic metadata: name: confluent-schemas labels: strimzi.io/cluster: cluster spec: partitions: 1 replicas: 3 config: # Schema Registry requires log compaction to ensure that the the latest version of each schema is always retained # ref: https://docs.confluent.io/platform/current/schema-registry/installation/deployment.html#don-t-modify-these-storage-settings cleanup.policy: compactbase\kafka-user.yamlkind: KafkaUser metadata: name: schema-registry labels: strimzi.io/cluster: cluster spec: authentication: type: scram-sha-512 password: valueFrom: secretKeyRef: name: schema-registry-kafka-secret key: password authorization: type: simple # Authorization using ACLS acls: # Schema Registry ACLS # ref: https://docs.confluent.io/platform/current/schema-registry/security/index.html#authorizing-access-to-the-schemas-topic - resource: type: topic name: confluent-schemas patternType: literal operations: - All host: "*" - resource: type: topic name: __consumer_offsets patternType: literal operations: - Describe host: "*" - resource: type: group name: schema-registry patternType: prefix operations: - All host: "*" -
Service Account
base/service-account.yamlapiVersion: v1 kind: ServiceAccount metadata: name: schema-registry-sa -
Deployment
base/deployment.yamlapiVersion: apps/v1 kind: Deployment metadata: name: schema-registry labels: app: schema-registry-schema-registry app.kubernetes.io/name: schema-registry app.kubernetes.io/instance: schema-registry spec: replicas: 1 selector: matchLabels: app: schema-registry-schema-registry app.kubernetes.io/name: schema-registry app.kubernetes.io/instance: schema-registry template: metadata: labels: app: schema-registry-schema-registry app.kubernetes.io/name: schema-registry app.kubernetes.io/instance: schema-registry spec: # enableServiceLings=false. Automatic ingestion of service environment variables is not desired # schema-registry service injects SCHEMA_REGISTRY_PORT variable which makes the schema registry fail to start # See https://github.com/confluentinc/schema-registry/issues/689#issuecomment-824769666 enableServiceLinks: false serviceAccountName: schema-registry-sa securityContext: fsGroup: 1000 containers: - name: schema-registry imagePullPolicy: IfNotPresent image: "docker.io/confluentinc/cp-schema-registry:7.9.2" env: # Confluent Schema Registry configuration through environment variables that are translated to configuration options # ref: https://docs.confluent.io/platform/current/installation/docker/config-reference.html#sr-long-configuration # Complete set of configuration options in https://docs.confluent.io/platform/current/schema-registry/installation/config.html - name: SCHEMA_REGISTRY_HOST_NAME valueFrom: fieldRef: apiVersion: v1 fieldPath: status.podIP - name: SCHEMA_REGISTRY_LISTENERS value: "http://0.0.0.0:8081" # KafkaStore configuration - name: SCHEMA_REGISTRY_KAFKASTORE_BOOTSTRAP_SERVERS value: SASL_PLAINTEXT://cluster-kafka-bootstrap:9092 - name: SCHEMA_REGISTRY_KAFKASTORE_SECURITY_PROTOCOL value: SASL_PLAINTEXT - name: SCHEMA_REGISTRY_KAFKASTORE_SASL_MECHANISM value: SCRAM-SHA-512 - name: SCHEMA_REGISTRY_KAFKASTORE_SASL_JAAS_CONFIG valueFrom: secretKeyRef: name: schema-registry-jaas-config key: plain-jaas.conf # Set Schema Registry KafkaStore topic (unstead of using default _schemas) - name: SCHEMA_REGISTRY_KAFKASTORE_TOPIC value: confluent-schemas - name: SCHEMA_REGISTRY_MASTER_ELIGIBILITY value: "true" - name: SCHEMA_REGISTRY_SCHEMA_COMPATIBILITY_LEVEL value: "backward" # Enabling HTTP Basic Auth # ref: https://docs.confluent.io/platform/current/security/authentication/http-basic-auth/overview.html#schema-registry - name: SCHEMA_REGISTRY_OPTS value: -Djava.security.auth.login.config=/etc/auth/registry-jaas.conf - name: SCHEMA_REGISTRY_AUTHENTICATION_REALM value: SchemaRegistry-Props - name: SCHEMA_REGISTRY_AUTHENTICATION_METHOD value: BASIC - name: SCHEMA_REGISTRY_AUTHENTICATION_ROLES value: 'admin,user,developer' - name: PROBE_USER value: probe - name: PROBE_PASSWD valueFrom: secretKeyRef: name: schema-registry-secrets key: probe-password ports: - name: http containerPort: 8081 protocol: TCP livenessProbe: tcpSocket: port: http initialDelaySeconds: 30 periodSeconds: 10 timeoutSeconds: 5 successThreshold: 1 failureThreshold: 6 readinessProbe: # Readiness Probe to use user/password. All endpoints secured by Basic Auth exec: command: - /bin/sh - -c - | curl -G --fail --silent --output /dev/null -u $PROBE_USER:$PROBE_PASSWD localhost:8081 initialDelaySeconds: 10 periodSeconds: 10 timeoutSeconds: 5 successThreshold: 1 failureThreshold: 6 volumeMounts: - name: tmp mountPath: /tmp readOnly: true - name: config mountPath: /etc/schema-registry - name: config-auth mountPath: /etc/auth readOnly: true securityContext: allowPrivilegeEscalation: false capabilities: drop: - ALL readOnlyRootFilesystem: true runAsGroup: 1000 runAsUser: 1000 resources: limits: cpu: 750m memory: 768Mi requests: cpu: 500m memory: 512Mi volumes: - name: config emptyDir: {} - name: tmp emptyDir: {} # REST API passwords file - name: config-auth projected: defaultMode: 420 sources: - secret: name: schema-registry-passwords - configMap: name: schema-registry-jaasNote:
Schema Registry version is set indicated corresponding schema-registry docker confluent image tag. In the previous YAML file version 7.9.2 is set.
-
Service
base/service.yamlapiVersion: v1 kind: Service metadata: name: schema-registry labels: app: schema-registry-schema-registry app.kubernetes.io/name: schema-registry app.kubernetes.io/instance: schema-registry spec: type: ClusterIP ports: - name: http port: 8081 protocol: TCP targetPort: http selector: app: schema-registry-schema-registry app.kubernetes.io/name: schema-registry app.kubernetes.io/instance: schema-registry -
Ingress
base/ingress.yamlapiVersion: networking.k8s.io/v1 kind: Ingress metadata: annotations: # Enable cert-manager to create automatically the SSL certificate and store in Secret cert-manager.io/cluster-issuer: letsencrypt-issuer cert-manager.io/common-name: schema-registry.${CLUSTER_DOMAIN} labels: app.kubernetes.io/name: schema-registry name: schema-registry spec: ingressClassName: nginx rules: - host: schema-registry.${CLUSTER_DOMAIN} http: paths: - backend: service: name: schema-registry port: number: 8081 path: / pathType: ImplementationSpecific tls: - hosts: - schema-registry.${CLUSTER_DOMAIN} secretName: schema-registry-certNote: Substitute variables (
${var}) in the above yaml file before deploying helm chart.- Replace
${CLUSTER_DOMAIN}by the domain name used in the cluster. For example:homelab.ricsanfre.comFQDN must be mapped, in cluster DNS server configuration, to NGINX Ingress Controller’s Load Balancer service external IP. External-DNS can be configured to automatically add that entry in your DNS service.
- Replace
-
Overlay Kustomization file
overlays/proc/kustomization.yamlapiVersion: kustomize.config.k8s.io/v1beta1 kind: Kustomization namespace: kafka resources: - ../../base
Important:
Kustomize packaged application for deploying Schema Registry using FluxCD can be found in Pi Cluster GitHub repo: schema-registry-app. Its structure is slightly different from the one documented here:
- It uses External Secrets to extract all passwords dynamically from Hashicorp Vault and generate the needed Kubernetes Secrets
- It use Kustomize Component concept so, Schema Registry can be deployed without using Kafka Store security or REST API Security.
Schema Registry Application Configuration Details
Kafka Store Backend Configuration
Schema Registry uses Kafka as backend for storing Schemas. By default it uses a topic named _schemas for storing different versions of the schemas.
Schema Registry can be configured to use Kafka authentication/authorization mechanism (SASL/SCRAM and ACL) to access Kafka backend, Kafka store, and retrieve and write schemas to the Kafka topics.
-
Kafka Configuration
- Kafka Topic: A specific topic
confluent-schemasis created using corresponding Strimzi’sKafkaTopicresource, so Schema Registry does not need to be granted with permissions to create topics. - Kafka User: A specific user
schema-registryis created with ACLs granting read-write access toconfluent-schemasand read access to__consumer_offsetstopic and access to consumer groupschema-registry*. ACL persmissions required are described in Schema Registry Documentation: Authorizing Access to the Schemas Topic
- Kafka Topic: A specific topic
-
Schema Registry configuration
The following environment variables are used to configure backend
Schema Registry Property Docker Image Environment Variable Description kafkastore.bootstrap.serversSCHEMA_REGISTRY_KAFKASTORE_BOOTSTRAP_SERVERSSet to SASL_PLAINTEXT://cluster-kafka-bootstrap:9092so internal non-TLS Kafka listener port can be used for the connectionkafkastore.security.protocolSCHEMA_REGISTRY_KAFKASTORE_SECURITY_PROTOCOLSet to SASL_PLAINTEXTkafkastore.sasl.mechanismSCHEMA_REGISTRY_KAFKASTORE_SASL_MECHANISMSet to SCRAM-SHA-512kafkastore.sasl.jaas.configSCHEMA_REGISTRY_KAFKASTORE_SASL_JAAS_CONFIGSet to org.apache.kafka.common.security.scram.ScramLoginModule required username=schema-registry password=supers1cret0;including user/password using to connect to Kafka backendkafkastore.topicSCHEMA_REGISTRY_KAFKASTORE_TOPICOverwriting default _schematopic name withconfluent-schemas
REST API Security Configuration
HTTP Basic Auth is the only REST API security mechanism available in the open-source edition of Schema Registry
Important:
Limitations of opensource version
- No RBAC is supported by opensource version. HTTP basic auth can be used only to authenticate the user.
- All endpoints are secured with basic auth. There is not public endpoint to check the healthy of the service.
The following environment variables are used to configure Basic Auth
| Schema Registry Property | Docker Image Environment Variable | Description |
|---|---|---|
authentication.realm |
SCHEMA_REGISTRY_AUTHENTICATION_REALM |
Set to SchemaRegistryProps |
authentication.method |
SCHEMA_REGISTRY_AUTHENTICATION_METHOD |
Set to BASIC. Basic auth is the only available in opensource version |
authentication.roles |
SCHEMA_REGISTRY_AUTHENTICATION_ROLES |
roles defined. RBAC is not available for opensource version so roles defined do not have any effect |
Also JVM argument need to be passed:
-Djava.security.auth.login.config=/etc/auth/registry-jaas.conf
This argument is set using Schema Registry environemnt variable SCHEMA_REGISTRY_OPTS
Where:
-
/etc/auth/registry-jaas.conf:SchemaRegistry-Props { org.eclipse.jetty.jaas.spi.PropertyFileLoginModule required file="/tmp/passwords" debug="true"; }; -
/tmp/passwordscontains the user passwords and roles assignmentsuser1: password, role1, role2
These files are mounted as volumes in Schema Registry POD from a ConfigMap and Secret
Further details about configuring Basic Auth can be found in Schema Registry Documentation - Authenticate with HTTP Basic Auth.
Install Schema Registry application
-
Step 1: Install Schema Registry
kubectl kustomize schema-registry | kubectl apply -f - -
Step 2: Check schema registry started
kubectl logs kafka-schema-registry-<podid> schema-registry -n kafka [2025-09-09 08:47:00,783] INFO HV000001: Hibernate Validator 6.2.0.Final (org.hibernate.validator.internal.util.Version) [2025-09-09 08:47:01,047] INFO Started o.e.j.s.ServletContextHandler@53a9fcfd{/,null,AVAILABLE} (org.eclipse.jetty.server.handler.ContextHandler) [2025-09-09 08:47:01,063] INFO Started o.e.j.s.ServletContextHandler@72456279{/ws,null,AVAILABLE} (org.eclipse.jetty.server.handler.ContextHandler) [2025-09-09 08:47:01,080] INFO Started NetworkTrafficServerConnector@7fcf2fc1{HTTP/1.1, (http/1.1, h2c)}{0.0.0.0:8081} (org.eclipse.jetty.server.AbstractConnector) [2025-09-09 08:47:01,081] INFO Started @8214ms (org.eclipse.jetty.server.Server) [2025-09-09 08:47:01,082] INFO Schema Registry version: 7.9.0 commitId: 52f833498a83c686d8c1d00cd68628ef075c53bd (io.confluent.kafka.schemaregistry.rest.SchemaRegistryMain) [2025-09-09 08:47:01,082] INFO Server started, listening for requests... (io.confluent.kafka.schemaregistry.rest.SchemaRegistryMain) -
Step 3: Check schema registry REST API is accessible
curl https://schema-registry.${CLUSTER_DOMAIN}/subjects
[]
If HTTP Basic Auth has been enabled, access is denied when not providing user credentials
$ curl https://schema-registry.${CLUSTER_DOMAIN}/subjects
{"error_code":401,"message":"Unauthorized"}
and access is granted when providing user and password credentials.
$ curl -u user:changeme https://schema-registry.${CLUSTER_DOMAIN}/subjects
[]
Testing Schema Registry
To test producers and consumers using Schema Registry, a set of kafka python clients can be used.
Testing clients are developed using confluent-kafka-python. Testing code is based on the samples code provided in python repository confluent-kafka-python - Examples.
See avro_producer.py and avro_consumer.py source code in kafka-testing-clients
Configure Kafka Topics and Users
Apply the following manifets to:
- Create
test-topic-avroKafka topic - Reconfigure
producerandconsumerKafka clients so they can access both testing topics (test-topicandtest-topic-avro).
# Kafka Topic
---
apiVersion: kafka.strimzi.io/v1
kind: KafkaTopic
metadata:
  name: test-topic-avro
  labels:
    strimzi.io/cluster: cluster
spec:
  partitions: 1
  replicas: 3
  config:
    retention.ms: 7200000
    segment.bytes: 1073741824
# Kafka Users
---
apiVersion: kafka.strimzi.io/v1
kind: KafkaUser
metadata:
  name: producer
  labels:
    strimzi.io/cluster: cluster
spec:
  authentication:
    type: scram-sha-512
    password:
      valueFrom:
        secretKeyRef:
          name: kafka-secrets
          key: producer-password
  authorization:
    type: simple # Authorization using ACLS
    acls:
      - resource:
          type: topic
          name: test-topic
          patternType: prefix
        operations:
          - Create
          - Describe
          - Write
        host: "*"
---
apiVersion: kafka.strimzi.io/v1
kind: KafkaUser
metadata:
  name: consumer
  labels:
    strimzi.io/cluster: cluster
spec:
  authentication:
    type: scram-sha-512
    password:
      valueFrom:
        secretKeyRef:
          name: kafka-secrets
          key: consumer-password
  authorization:
    type: simple # Authorization using ACLS
    acls:
      - resource:
          type: topic
          name: test-topic
          patternType: prefix
        operations:
          - Describe
          - Read
        host: "*"
      - resource:
          type: group
          name: test-consumer-group
          patternType: prefix
        operations:
          - Read
        host: "*"
Installing python clients
A linux server (i.e Ansible Control Node or laptop) can be used to execute AVRO cosumer and producer To execute python code, first a virtual environment needs to be configured
-
Create testing directory
mkdir -p test/kafka mkdir -p test/kafka/avro cd test/kafka -
Install
uvPython package and project managerSee installation instructions of your OS.
In Ubuntu 24.04, it can be installed via snap.
sudo snap install astral-uv --classic -
Initialize python uv python project
uv inituv initcommand will create corresponding Python virtual environment - Add required dependencies
uv add confluent-kafka[avro,schemaregistry] uv add six - Copy
avro_producer.pyandavro_consumer.pytotest/kafkadirectory and testing avro schema totest/kafka/avrodirectory
Testing AVRO clients
-
Go to
test/kafkadirectorycd test/kafka -
Export environment variables
Set environment variables for Kafka bootstrap server and Schema Registry connectivity
For example:
export KAFKA_REMOTE_BOOTSTRAP=kafka-bootstrap.${CLUSTER_DOMAIN} export KAFKA_SCHEMA_REGISTRY=schema-registry.${CLUSTER_DOMAIN} export SCHEMA_REGISTRY_PASSWD=`kubectl get secret schema-registry-auth-secret -n kafka -o jsonpath='{.data.password}' | base64 --decode` -
Start AVRO Producer
uv run avro_producer.py \
    -b ${KAFKA_REMOTE_BOOTSTRAP}:443 \
    -s https://${KAFKA_SCHEMA_REGISTRY} \
    -su client \
    -sp ${SCHEMA_REGISTRY_PASSWD} \
    -t test-topic-avro \
    -m SCRAM-SHA-512 \
    --tls true \
    --user producer \
    --password supers1cret0
Enter required fields for building the message
-
Start AVRO Consumer in a different terminal
uv run avro_consumer.py \ -b ${KAFKA_REMOTE_BOOTSTRAP}:443 \ -s https://${KAFKA_SCHEMA_REGISTRY} \ -su client \ -sp ${SCHEMA_REGISTRY_PASSWD} \ -t test-topic-avro \ -m SCRAM-SHA-512 \ -g test-consumer-group \ --tls true \ --user consumer \ --password s1cret0 -
Check messages are appearing in AVRO consumer terminal as they are typed in in AVRO producer terminal Messages are printed decode using AVRO schema
-
Check schema
test-topic-avro-valueis stored in Schema registryTo get list of all schemas execute the following
$ curl -k --silent -u kafdrop:${SCHEMA_REGISTRY_PASSWD} https://schema-registry.${CLUSTER_DOMAIN}/subjects | jq .
[
  "test-topic-avro-value"
]
To get details of the
test-topic-avro-valueschema execute the following:$ curl -k --silent -u kafdrop:${SCHEMA_REGISTRY_PASSWD} https://schema-registry.${CLUSTER_DOMAIN}/subjects/test-topic-avro-value/versions/1 | jq . { "subject": "test-topic-avro-value", "version": 1, "id": 1, "schema": "{\"type\":\"record\",\"name\":\"User\",\"namespace\":\"confluent.io.examples.serialization.avro\",\"fields\":[{\"name\":\"name\",\"type\":\"string\"},{\"name\":\"favorite_number\",\"type\":\"long\"},{\"name\":\"favorite_color\",\"type\":\"string\"}]}" }
Kafka UI (Kafdrop)
Kafdrop is a web UI for viewing Kafka topics and browsing consumer groups. The tool displays information such as brokers, topics, partitions, consumers, and lets you view messages.
Even when helm chart source code is available in Kafdrop’s repository, it is not hosted in any official helm repository. Instead of self-hosting that helm chart, since the Kafdrop installation helm chart contains simple templates for a Deployment, Service and Ingress resources, I have decided to createa packaged kustomize application.
Kustomize Kafdrop application
The application have the following directory structure
└── kafdrop
    ├── base
    │   ├── deployment.yaml
    │   ├── service.yaml
    │   ├── ingress.yaml
    │   ├── kafka-secrets.yaml
    │   ├── kafka-user.yaml
    │   └── kustomization.yaml
    └── overlays
        ├── dev
        │   └── kustomization.yaml
        └── prod
            └── kustomization.yaml
-
Kustomization base file
base/kustomization.yamlapiVersion: kustomize.config.k8s.io/v1beta1 kind: Kustomization resources: - deployment.yaml - service.yaml - ingress.yaml -
Secrets (Kafka Credentials and Kafka Properties containing SASL/SCRAM and JAAS Config)
base\kafka-secrets.yaml--- apiVersion: v1 kind: Secret metadata: name: kafdrop-kafka-secret stringData: username: kafdrop password: supers1cret0 --- apiVersion: v1 kind: Secret metadata: name: kafdrop-schema-registry-secret stringData: username: kafdrop password: supers1cret0 --- apiVersion: v1 kind: Secret metadata: name: schema-registry-jaas-config stringData: kafka.properties: | security.protocol=SASL_PLAINTEXT sasl.mechanism=SCRAM-SHA-512 sasl.jaas.config=org.apache.kafka.common.security.scram.ScramLoginModule required username=kafdrop password=supers1cret0; -
Kafka configuration: Kafdrop User creation. Create
kafdropuser with read-only permissions.base\kafka-user.yamlapiVersion: kafka.strimzi.io/v1 kind: KafkaUser metadata: name: kafdrop labels: strimzi.io/cluster: cluster spec: authentication: type: scram-sha-512 password: valueFrom: secretKeyRef: name: kafdrop-kafka-secret key: password authorization: type: simple # Authorization using ACLS acls: - resource: type: topic name: "*" patternType: literal operations: - Read - Describe host: "*" - resource: type: group name: "*" patternType: literal operations: - Read - Describe host: "*" - resource: type: cluster operations: - Read - Describe host: "*" - resource: type: transactionalId name: "*" patternType: literal operations: - Read - Describe host: "*" -
Deployment
base\deployment.yamlapiVersion: apps/v1 kind: Deployment metadata: labels: app.kubernetes.io/instance: kafdrop app.kubernetes.io/name: kafdrop name: kafdrop spec: replicas: 1 selector: matchLabels: app.kubernetes.io/instance: kafdrop app.kubernetes.io/name: kafdrop template: metadata: labels: app.kubernetes.io/instance: kafdrop app.kubernetes.io/name: kafdrop spec: containers: - name: kafdrop image: obsidiandynamics/kafdrop:4.2.0 imagePullPolicy: Always ports: - containerPort: 9000 name: http protocol: TCP env: # Kafka - name: KAFKA_BROKERCONNECT value: cluster-kafka-bootstrap:9092 # Kafka security credentials in kafka.properties file - name: KAFKA_PROPERTIES_FILE value: /etc/kafdrop/kafka.properties # Schema Registry credential - name: REGISTRY_PASSWORD valueFrom: secretKeyRef: name: kafdrop-schema-registry-secret key: password - name: JVM_OPTS value: -Xms32M -Xmx64M - name: JMX_PORT value: "8686" - name: SERVER_PORT value: "9000" # Schema Registry connection - name: CMD_ARGS value: --schemaregistry.connect=http://schema-registry:8081 --schemaregistry.auth=kafdrop:${REGISTRY_PASSWORD} readinessProbe: failureThreshold: 3 httpGet: path: /actuator/health port: http scheme: HTTP initialDelaySeconds: 20 periodSeconds: 5 successThreshold: 1 timeoutSeconds: 10 livenessProbe: failureThreshold: 3 httpGet: path: /actuator/health port: http scheme: HTTP initialDelaySeconds: 180 periodSeconds: 30 successThreshold: 1 timeoutSeconds: 10 resources: requests: cpu: 1m memory: 128Mi # Mount kafka.properties in /etc/kafdrop - name: kafdrop-config mountPath: /etc/kafdrop volumes: - name: kafdrop-config secret: secretName: kafdrop-config defaultMode: 0644Note:
Kafdrop version is set indicated corresponding kafdrop docker image tag. In the previous YAML file version 4.2.0 is set.
-
Service
base/service.yamlapiVersion: v1 kind: Service metadata: name: kafdrop labels: app.kubernetes.io/instance: kafdrop app.kubernetes.io/name: kafdrop spec: ports: - port: 9000 targetPort: 9000 name: kafdrop protocol: TCP selector: app.kubernetes.io/instance: kafdrop app.kubernetes.io/name: kafdrop type: ClusterIP -
Ingress
base/ingress.yamlapiVersion: networking.k8s.io/v1 kind: Ingress metadata: annotations: cert-manager.io/cluster-issuer: letsencrypt-issuer cert-manager.io/common-name: kafdrop.${CLUSTER_DOMAIN} labels: app.kubernetes.io/instance: kafdrop app.kubernetes.io/name: kafdrop name: kafdrop spec: ingressClassName: nginx rules: - host: kafdrop.${CLUSTER_DOMAIN} http: paths: - backend: service: name: kafdrop port: name: kafdrop path: / pathType: ImplementationSpecific tls: - hosts: - kafdrop.${CLUSTER_DOMAIN} secretName: kafdrop-tlsNote:
Substitute variables (
${var}) in the above yaml file before deploying helm chart.- Replace
${CLUSTER_DOMAIN}by the domain name used in the cluster. For example:homelab.ricsanfre.comFQDN must be mapped, in cluster DNS server configuration, to NGINX Ingress Controller’s Load Balancer service external IP. External-DNS can be configured to automatically add that entry in your DNS service.
Ingress Controller NGINX exposes kafdrop server as
kafdrop.${CLUSTER_DOMAIN}virtual host, routing rules are configured for redirecting all incoming HTTP traffic to HTTPS and TLS is enabled using a certificate generated by Cert-manager.See “Ingress NGINX Controller - Ingress Resources Configuration” for furher details.
ExternalDNS will automatically create a DNS entry mapped to Load Balancer IP assigned to Ingress Controller, making kafdrop service available at `kafdrop.{$CLUSTER_DOMAIN}. Further details in “External DNS - Use External DNS”
- Replace
-
Overlay Kustomization file
overlays/proc/kustomization.yamlapiVersion: kustomize.config.k8s.io/v1beta1 kind: Kustomization namespace: kafka resources: - ../../base
Important:
Kustomize packaged application for deploying Kafdrop using FluxCD can be found in Pi Cluster GitHub repo: kafdrop-app. It structure is slightly different from the ones documented here:
- It uses External Secrets to extract all passwords dynamically from Hashicorp Vault and generate the needed Kubernetes Secrets
- It use Kustomize Component concept so, Kafdrop can be deployed with a secured Kafka (SASL/SCRAM) or not secured Kafka. Also optionally it can be installed with Schema Registry support which REST API is not secured or secured with HTTP Basic Auth.
Kafdrop Application Configuration Details
Kafka Access Configuration
Kafdrop has to be configured to use Kafka authentication/authorization mechanism (SASL/SCRAM and ACL) to access Kafka
-
Kafka Configuration: A specific
KafkaUser,kafdrop, is created with ACLs granting read-only access to all Kafka resources (topics, consumer groups, etc.) -
Kafdrop Kafka access configuration: To access using SASL/SCRAM authentication the following configuration need to be provided
KAFKA_BROKERCONNECTpointing to Strimzi’s Kafka bootstrap service (cluster-kafka-bootstrap:9092)KAFKA_PROPERTIES_FILEpointing tokafka.propertiesfile containing Kafka access details (SASL protocol, mechanism and credentials)Where
kafka.propertiesfile is mounted as POD volume from a ConfigMap:security.protocol=SASL_PLAINTEXT sasl.mechanism=SCRAM-SHA-512 sasl.jaas.config=org.apache.kafka.common.security.scram.ScramLoginModule required username=kafdrop password=supers1cret0;
Schema Registry Access Configuration
Access to Schema registry need to be configured as kafdrop command line arguments:
--schemaregistry.connect=http://schema-registry:8081
If HTTP Basic Auth is configured in Schema Registry additional:
--schemaregistry.auth=user:password
Both options are provided to Kafdrop Docker image via environment variable CMD_ARGS
Kafdrop Installation
-
Step 1: Install Kafdrop application
kubectl kustomize kafdrop | kubectl apply -f - -
Step 2: Check schema registry started
kubectl logs kafdrop-<podid> -n kafka -
Step 4: Confirm that the deployment succeeded, opening UI:
https://kafdrop.${CLUSTER_DOMAIN}