Observability Visualization (Grafana)
Grafana is an open source Observability and data visualization platform.
It can be used to visualize different telemetry signals (metrics, logs, and traces) from multiple sources like Prometheus, Loki, Elasticsearch, InfluxDB, Postgres and many more.
Grafana is used in Pi Cluster as Visualization layer for Observability platform able to connect to the different Telemetry back-ends used to handle different telemetry signals: Prometheus for metrics, Grafana Loki’s for logs and Grafana Tempo for traces.
Installation
Grafana can be automatically installed and pre-configured as part of Kube-Prometheus-Stack. To have more control over the version and the configuration (i.e namespace or release names), kube-prometheus-stack can be configured to skip Grafana installation and Grafana Helm Chart can be installed separatedly.
Installation using Helm (Release 3):
-
Step 1: Add Grafana’s Helm repository:
helm repo add grafana https://grafana.github.io/helm-charts -
Step 2: Fetch the latest charts from the repository:
helm repo update -
Step 3: Create namespace
kubectl create namespace grafana -
Step 4: Create helm values file
grafana-values.ymlcontaining Grafana deployment configuration# Admin user password adminUser: admin adminPassword: "admin_password" # Adding Prometheus and AlertManager data sources datasources: datasources.yaml: apiVersion: 1 deleteDatasources: - { name: Alertmanager, orgId: 1 } - { name: Prometheus, orgId: 1 } datasources: - name: Prometheus type: prometheus uid: prometheus access: proxy url: http://kube-prometheus-stack-prometheus.kube-prom-stack.svc.cluster.local:9090/ jsonData: httpMethod: POST timeInterval: 30s isDefault: true - name: Alertmanager type: alertmanager uid: alertmanager url: http://kube-prometheus-stack-alertmanager.kube-prom-stack.svc.cluster.local:9093/ access: proxy jsonData: handleGrafanaManagedAlerts: false implementation: prometheusThis values.yaml configures Grafana with the following options:
- Admin password is specified (
grafana.adminPassword) - Prometheus data source is added (
grafana.datasources)
- Admin password is specified (
-
Step 5: Install Grafana Helm chart
helm -f grafana-values.yml install grafana grafana/grafana --namespace grafana -
Step 6: Confirm that the deployment succeeded, run:
kubectl -n grafana get pod
GitOps installation
As an alternative, for GitOps deployments, credentials should not be set in Helm chart values.yaml file
-
Grafana’s admin credentials can be in stored in an existing Secret.
Create the following secret:
apiVersion: v1
kind: Secret
metadata:
  name: grafana
  namespace: grafana
type: Opaque
data:
  admin-user: < grafana_admin_user | b64encode>
  admin-password: < grafana_admin_password | b64encode>
For encoding the admin and password values execute the following commands:
echo -n "<grafana_admin_user>" | base64
echo -n "<grafana_admin_password>" | base64
Add the following configuration to Helm
values.yaml:# Use an existing secret for the admin user. adminUser: "" adminPassword: "" admin: existingSecret: grafana userKey: admin-user passwordKey: admin-password -
Other Configuration parameters can be provided as environment variables Grafana configuration parameters in .ini file can be overridden with environment variables Some sensitive configuration parameters, like SSO secrets, are not allowed by Helm chart to be provided as part of the
values.yamlfile. In this case this configuration need to be provided as environment variables Any Grafana option ingrafana.iniconfig file can be override with the following environment variable:GF_<SectionName>_<KeyName>Where the section name is the text within the brackets. Everything should be uppercase, . and - should be replaced by _
For example to provide OAuth credentials the following
grafana.iniconfiguration should be providedgrafana.ini: # SSO configuration auth.generic_oauth: enabled: true name: <client-app-name> allow_sign_up: true client_id: <client-id> client_secret: <client-secret>To provide
client_secretparameter:Create a secret containing environment variable
GF_AUTH_GENERIC_OAUTH_CLIENT_SECRET:apiVersion: v1 kind: Secret metadata: name: grafana-env-secret namespace: grafana type: Opaque data: GF_AUTH_GENERIC_OAUTH_CLIENT_SECRET: < grafana-client-secret | b64encode>Add the following Helm values configuration, so environment variables can be loaded from the secret:
envFromSecret: grafana-env-secret
Configuration
Ingress configuration
Add following configuration to access Grafana via Ingress Controller using a subpath (http://<domain>/grafana) without configuring any rewrite rule in the reverse HTTP Proxy.
# Configuring /grafana subpath
grafana.ini:
server:
domain: monitoring.homelab.ricsanfre.com
root_url: "%(protocol)s://%(domain)s:%(http_port)s/grafana/"
# Running Grafana behind proxy rewrite path
# https://grafana.com/tutorials/run-grafana-behind-a-proxy/
serve_from_sub_path: true
The following Ingress for NGINX Ingress controller can be defined:
apiVersion: networking.k8s.io/v1
kind: Ingress
metadata:
name: grafana
namespace: grafana
annotations:
# Enable cert-manager to create automatically the SSL certificate and store in Secret
cert-manager.io/cluster-issuer: ca-issuer
cert-manager.io/common-name: monitoring.${CLUSTER_DOMAIN}
spec:
ingressClassName: nginx
tls:
- hosts:
- monitoring.${CLUSTER_DOMAIN}
secretName: monitoring-tls
rules:
- host: monitoring.${CLUSTER_DOMAIN}
http:
paths:
- path: /grafana
pathType: Prefix
backend:
service:
name: grafana
port:
number: 80
Or add the following configuration to Helm values.yaml
# Ingress configuration
ingress:
enabled: true
ingressClassName: nginx
# Values can be templated
annotations:
# Enable cert-manager to create automatically the SSL certificate and store in Secret
cert-manager.io/cluster-issuer: ca-issuer
cert-manager.io/common-name: monitoring.${CLUSTER_DOMAIN}
path: /grafana
pathType: Prefix
hosts:
- monitoring.${CLUSTER_DOMAIN}
tls:
- hosts:
- monitoring.${CLUSTER_DOMAIN}
secretName: monitoring-tls
Note:
Substitute variables (${var}) in the above yaml file before deploying manifest.
- Replace
${CLUSTER_DOMAIN}by the domain name used in the cluster. For example:homelab.ricsanfre.com.
Ingress Controller NGINX exposes grafana server as monitoring.${CLUSTER_DOMAIN} virtual host, and route all requests to /grafana path to Grafana backend. Routing rules are also configured for redirecting all incoming HTTP traffic to HTTPS and TLS is enabled using a certificate generated by Cert-manager.
See “Ingress NGINX Controller - Ingress Resources Configuration” for furher details.
ExternalDNS will automatically create a DNS entry mapped to Load Balancer IP assigned to Ingress Controller, making grafana service available at monitoring.{$CLUSTER_DOMAIN}/grafana. Further details in “External DNS - Use External DNS”
Provisioning Data Sources
Grafana datasources can be configured through datasource.yaml files located in a provisioning directory (/etc/grafana/provisioning/datasources). See Grafana Tutorial: Provision dashboards and data sources
Provisioning Data Sources on start-up
datasource.yaml file can be provided when installing Grafana’s helm chart adding datasources.yaml file to values.yaml
datasources:
datasources.yaml:
apiVersion: 1
deleteDatasources:
- { name: Alertmanager, orgId: 1 }
- { name: Loki, orgId: 1 }
- { name: Prometheus, orgId: 1 }
- { name: Tempo, orgId: 1 }
datasources:
- name: Prometheus
type: prometheus
uid: prometheus
access: proxy
url: http://kube-prometheus-stack-prometheus.kube-prom-stack.svc.cluster.local:9090/
jsonData:
httpMethod: POST
timeInterval: 30s
isDefault: true
- name: Alertmanager
type: alertmanager
uid: alertmanager
url: http://kube-prometheus-stack-alertmanager.kube-prom-stack.svc.cluster.local:9093/
access: proxy
jsonData:
handleGrafanaManagedAlerts: false
implementation: prometheus
- name: Loki
type: loki
uid: loki
access: proxy
url: http://loki-gateway.loki.svc.cluster.local
jsonData:
derivedFields:
- datasourceUid: tempo
matcherRegex: '"trace_id": "(\w+)"'
name: TraceID
url: $${__value.raw}
- name: Tempo
uid: tempo
type: tempo
access: proxy
url: http://tempo-query-frontend.tempo.svc.cluster.local:3200
Dynamic Provisioning of DataSources
When deploying Grafana in Kubernetes, datasources yaml config files can be imported dynamically from ConfigMaps.
This is implemented by a sidecar container, sc-datasources, that copies these ConfigMaps to its provisioning directory (/etc/grafana/provisioning/datasources)
Check out “Grafana chart documentation: Sidecar for Datasources” explaining how to enable/use this sidecar container.
-
Step 1: Enable Datasources sidecar container Add following configuration to Grafana Helm
values.yamlto enablesc-datasourcesidecar container:# Enable provisioning of datasources sidecar: datasources: enabled: true # Search in all namespaces for configMaps searchNamespace: ALL label: grafana_datasource labelValue: "1"This will search for ConfigMaps in all namespaces (
searchNamespace: ALL) containing the labelgrafana_datasource: "1". This configMaps should have a validdatasource.yamlconfig file. -
Step 2: Create ConfigMap containing
datasource.yamlfile containing label: `grafana_datasource: “1”apiVersion: v1 kind: ConfigMap metadata: name: prometheus-grafana-datasource namespace: kube-prom-stack labels: grafana_datasource: "1" data: datasource.yaml: |- apiVersion: 1 datasources: - name: "Prometheus" type: prometheus uid: prometheus url: http://kube-prometheus-stack-prometheus.kube-prom-stack:9090/ access: proxy isDefault: true jsonData: httpMethod: POST timeInterval: 30s - name: "Alertmanager" type: alertmanager uid: alertmanager url: http://kube-prometheus-stack-alertmanager.kube-prom-stack:9093/ access: proxy jsonData: handleGrafanaManagedAlerts: false implementation: prometheus
sc-datasource sidecar container picks this configMap up and store it into datasource provisioning directory (/etc/grafana/provisioning/datasources
Provisioning Dashboards
Grafana dashboards can be configured through provider definitions (dashboardproviders.yaml files) located in a provisioning directory (/etc/grafana/provisioning/dashboards). This yaml file contains the directory from where dashboards in json format can be automatically loaded. See Grafana Tutorial: Provision dashboards and data sources
Provisioning Dashboards on startup
dashboardproviders.yaml file can be provided when installing Grafana’s helm chart adding dashboardproviders.yaml file to values.yaml
Also for every provider configured a set of dashboards in JSON format can be provided
On start-up Grafana can be configured to configure different dashboardProviders so dashboards in JSON format can be loaded from file system.
dashboardProviders:
dashboardproviders.yaml:
apiVersion: 1
providers:
- name: <provider_name>
orgId: 1
folder: ""
type: file
disableDeletion: false
editable: true
options:
path: /var/lib/grafana/dashboards/<provider-folder>
dashboards:
<provider_name>:
some-dashboard:
json: |
$RAW_JSON
Grafana Helm template converts this dashboards into ConfigMaps that are automatically mounted into Grafana POD.
Known issue importing downloaded JSON files
Most of Grafana community dashboards available have been exported from a running Grafana and so they include a input variable (DS_PROMETHEUS) which represent a datasource which is referenced in all dashboard panels (${DS_PROMETHEUS}). See details in Grafana export/import documentation.
When automatic provisioning those exported dashboards following the procedure described above, an error appear when accessing them in the UI:
Datasource named ${DS_PROMETHEUS} was not found
There is an open Grafana´s issue, asking for support of dashboard variables in dashboard provisioning.
As a workarround, json files can be modified before inserting them into ConfigMap yaml file, in order to detect DS_PROMETHEUS datasource.
See issue #18 for more details
Modify each json file, containing DS_PROMETHEUS input variable within __input json key, adding the following code to templating.list key
"templating": {
"list": [
{
"hide": 0,
"label": "datasource",
"name": "DS_PROMETHEUS",
"options": [],
"query": "prometheus",
"refresh": 1,
"regex": "",
"type": "datasource"
},
...
Alternatively, ${DS_Prometheus} variable used within each element of the dashboard can be replaced by Prometheus data-source name
The following script download Minio dashboad (id 13502) and automatically replace S{DS_PROMETHEUS} by Prometheus using sed command
curl -skf --connect-timeout 60 \
--max-time 60 \
-H 'Accept: application/json' \
-H 'Content-Type: application/json;charset=UTF-8' \
https://grafana.com/api/dashboards/13502/revisions/26/download \
| sed 's/${DS_PROMETHEUS}/Prometheus/g > dashboard.json
Automating installation of Grafana community dashboards
Instead of embedding JSON files into Helm chart values.yaml, dashboards from Grafana community dashboards can be automatically provision during deployment.
A Grafana’s POD init-container, download-dashboards executes a script to download the files. This script also support the automatic replacement of any DS_PROMETEUS variable.
See script code in Grafana’s Helm chart template file: config.tpl
Dashboards to be downloaded can be specified in dashboard variable in Helm values.yaml, gnetId specifies dashboard Id and revision its revision.
dashboardProviders:
dashboardproviders.yaml:
apiVersion: 1
providers:
- name: <provider_name>
orgId: 1
folder: ""
type: file
disableDeletion: false
editable: true
options:
path: /var/lib/grafana/dashboards/<provider-folder>
dashboards:
<provider_name>:
<dashboard-name>:
gnetId: <dasbhoard_id>
revision: <dasboard_rev>
datasource:
- { name: DS_PROMETHEUS, value: Prometheus }
As an example the following can be used to automatically download and Install Minio, Longhorn and Logging dashboards
# Default dashboard provider
dashboardProviders:
dashboardproviders.yaml:
apiVersion: 1
providers:
- name: default
orgId: 1
folder: ""
type: file
disableDeletion: false
editable: true
options:
path: /var/lib/grafana/dashboards/<provider-folder>
# Dashboards
dashboards:
default:
minio:
# renovate: depName="MinIO Dashboard"
# https://grafana.com/grafana/dashboards/13502-minio-dashboard/
gnetId: 13502
revision: 26
datasource:
- { name: DS_PROMETHEUS, value: Prometheus }
longhorn:
# https://grafana.com/grafana/dashboards/16888-longhorn/
gnetId: 16888
revision: 9
datasource:
- { name: DS_PROMETHEUS, value: Prometheus }
logging:
# https://grafana.com/grafana/dashboards/7752-logging-dashboard/
gnetId: 7752
revision: 6
datasource:
- { name: DS_PROMETHEUS, value: Prometheus }
Grafana init container executes a script similar to:
#!/usr/bin/env sh
set -euf
mkdir -p /var/lib/grafana/dashboards/default-folder
# Minio dashboardh
curl -skf \
--connect-timeout 60 \
--max-time 60 \
-H "Accept: application/json" \
-H "Content-Type: application/json;charset=UTF-8" \
"https://grafana.com/api/dashboards/16888/revisions/9/download" \
| sed '/-- .* --/! s/\"datasource\":.*,/\"datasource\": \"Prometheus\",/g' \
> "/var/lib/grafana/dashboards/default-folder/longhorn.json"
# Longhorn dashboard
curl -skf \
-connect-timeout 60 \
--max-time 60 \
-H "Accept: application/json" \
-H "Content-Type: application/json;charset=UTF-8" \
"https://grafana.com/api/dashboards/13502/revisions/26/download" \
| sed '/-- .* --/! s/${DS_PROMETHEUS}/Prometheus/g' \
> "/var/lib/grafana/dashboards/default-folder/minio.json
Dynamic Provisioning of Dashboards
Grafana dashboards can be automatically provisioned using ConfigMaps. Provisioning sidecar containers has to be deployed to enable this feature.
When Grafana is deployed in Kubernetes using the helm chart, dashboards can be automatically provisioned enabling a sidecar container provisioner.
With this sidecar provider enabled, Grafana dashboards can be provisioned automatically creating ConfigMap resources containing the dashboard json definition. A provisioning sidecar container, sc-dashboards, must be enabled in order to look for those ConfigMaps in real time and automatically copy them to the provisioning directory (/tmp/dashboards).
Check out “Grafana chart documentation: Sidecar for Dashboards” explaining how to enable/use dashboard provisioning side-car.
Additional helm chart configuration is required for enabling the search for ConfigMaps in all namespaces (sidecar.dashboards.searchNamespaces: ALL), by default search is limited to grafana’s namespace and to enable the folder annotation (sidecar.dashboards.folderAnnotation), so imported dashboards can be loaded into specific directory using a specific annotation in the configMap
# Enable provisioning of dashboards and datasources
sidecar:
dashboards:
enabled: true
# Search in all namespaces for configMaps containing label `grafana_dashboard`
searchNamespace: ALL
label: grafana_dashboard
# set folder name through annotation `grafana_folder`
folderAnnotation: grafana_folder
provider:
disableDelete: true
foldersFromFilesStructure: true
Note:
Grafana helm chart creates the following /etc/grafana/provisioning/dashboard/sc-dashboardproviders.yaml file, which makes Grafana load all json dashboards from /tmp/dashboards
apiVersion: 1
providers:
- name: 'sidecarProvider'
orgId: 1
folder: ''
type: file
disableDeletion: true
allowUiUpdates: false
updateIntervalSeconds: 30
options:
foldersFromFilesStructure: true
path: /tmp/dashboards
For provision automatically a new dashboard, a new ConfigMap resource must be created, labeled with grafana_dashboard: 1 and containing as data the json file content. It can be annotated with grafana_folder so it can be included in a specfic directory
apiVersion: v1
kind: ConfigMap
metadata:
name: sample-grafana-dashboard
labels:
grafana_dashboard: "1"
annotations:
grafana_folder: "directory1"
data:
dashboard.json: |-
[json_file_content]
Following this procedure kube-prometheus-stack helm chart automatically deploy a set of Dashboards for monitoring metrics coming from Kubernetes processes and from Node Exporter. The list of kube-prometheus-stack grafana dashboards
For each dashboard a ConfigMap containing the json definition is created.
For the K8s disabled components kube-prometheus-stack do not deploy the corresponding dashboard, so they need to be added manually. See below section “K3S components monitoring” to know how to add manually those dashboards.
You can get all of them running the following command
kubectl get cm -l "grafana_dashboard=1" -n monitoring
Single Sign-On - IAM Integration
Grafana can be integrated with [[Identity Access Management]] solution to delegate authentication and enabling SSO. Grafana Open source version supports integration via OpenID Connect/OAuth 2.0 protocol
Details in Grafana documentation: https://grafana.com/docs/grafana/latest/setup-grafana/configure-security/planning-iam-strategy/
Keycloak integration
Keycloak is a IAM solution used in Pi Cluster to enable Single Sig-on. See details about Keycloak installation in “SSO with KeyCloak and Oauth2-Proxy”
Keycloak configuration: Configure Grafana Client
Grafana client application need to be configured within ‘picluster’ realm.
Procedure in Keycloak documentation: Keycloak: Creating an OpenID Connect client
Follow procedure in Grafana documentation: Configure Keycloak OAuth2 authentication to provide the proper configuration.
- Step 1: Create realm roles corresponding with Grafana’s roles:
editor,viewerandadmin -
Step 2: Create a new OIDC client in ‘picluster’ Keycloak realm by navigating to: Clients -> Create client
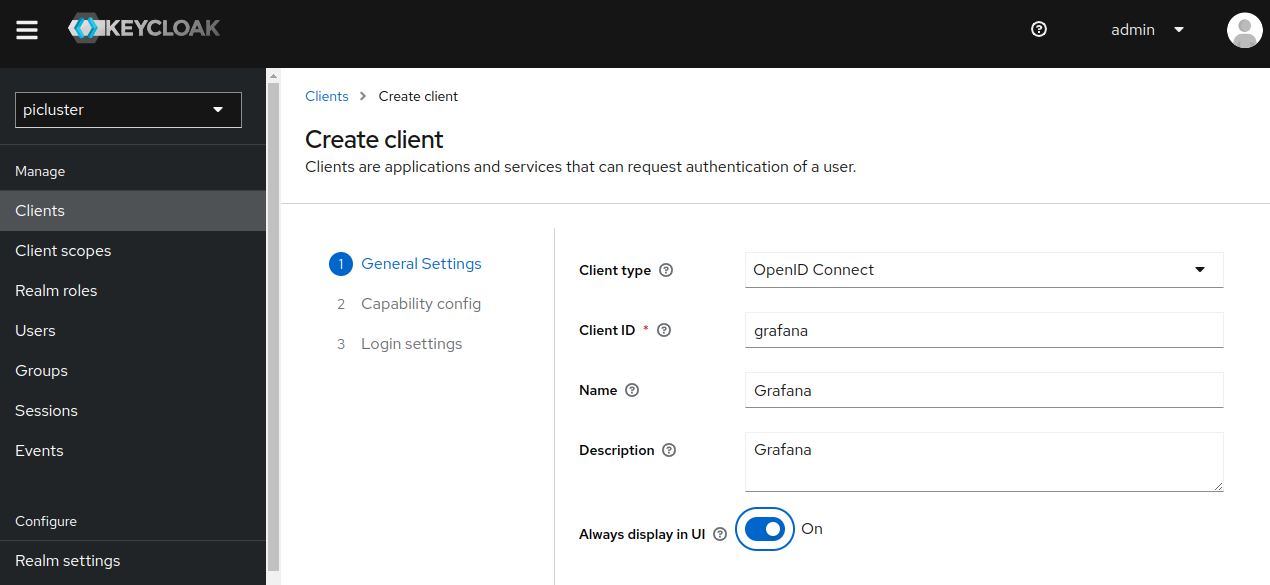
- Provide the following basic configuration:
- Client Type: ‘OpenID Connect’
- Client ID: ‘grafana’
- Click Next.
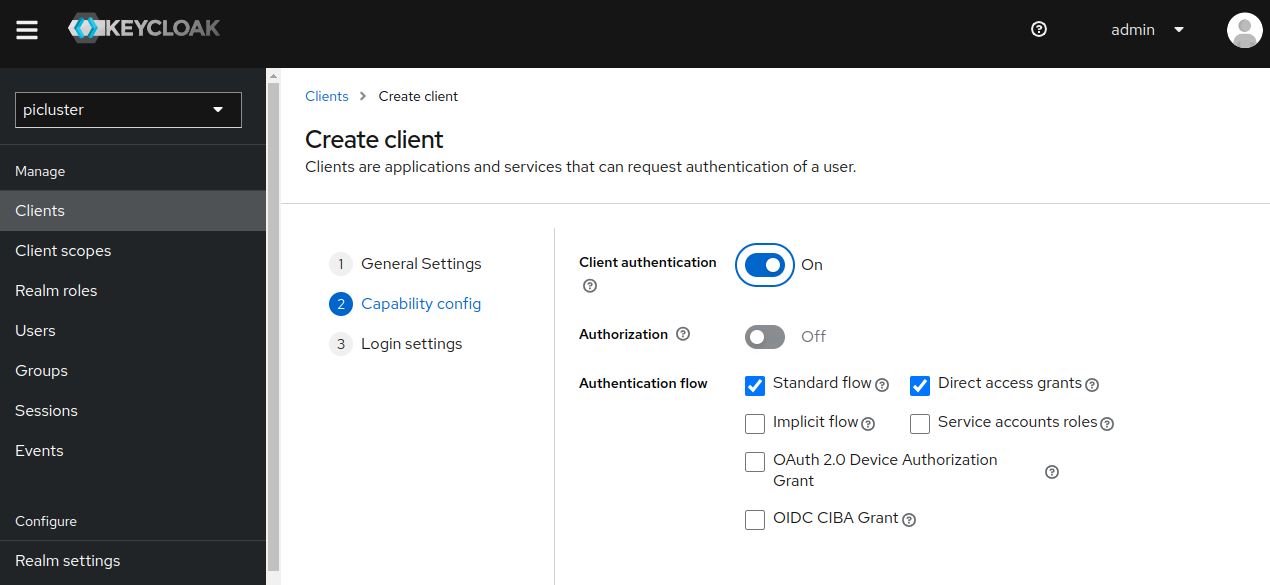
- Provide the following ‘Capability config’
- Client authentication: ‘On’
- Authentication flow
- Standard flow ‘selected’
- Direct access grants ‘selected’
-
Click Next
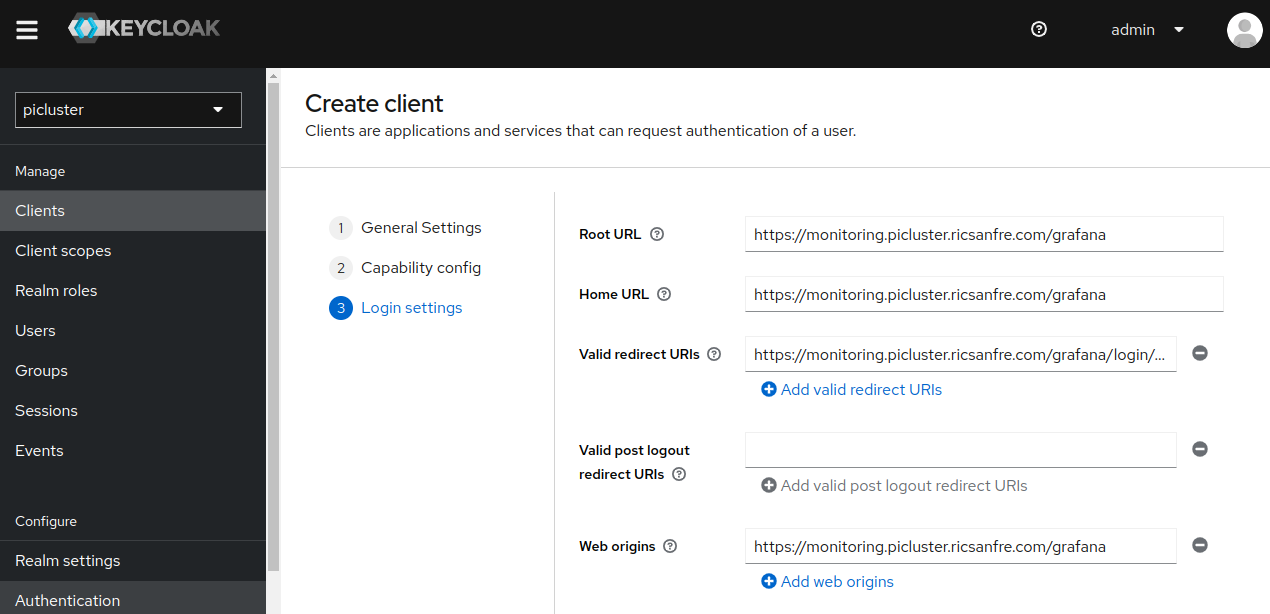
- Provide the following ‘Logging settings’
- Valid redirect URIs:
https://monitoring.S{CLUSTER_DOMAIN}/grafana/login/generic_oauth - Home URL: https://monitoring.S{CLUSTER_DOMAIN}/grafana
- Root URL: https://monitoring.S{CLUSTER_DOMAIN}/grafana
- Web Origins: https://monitoring.S{CLUSTER_DOMAIN}/grafana
- Valid redirect URIs:
- Save the configuration.
- Provide the following basic configuration:
-
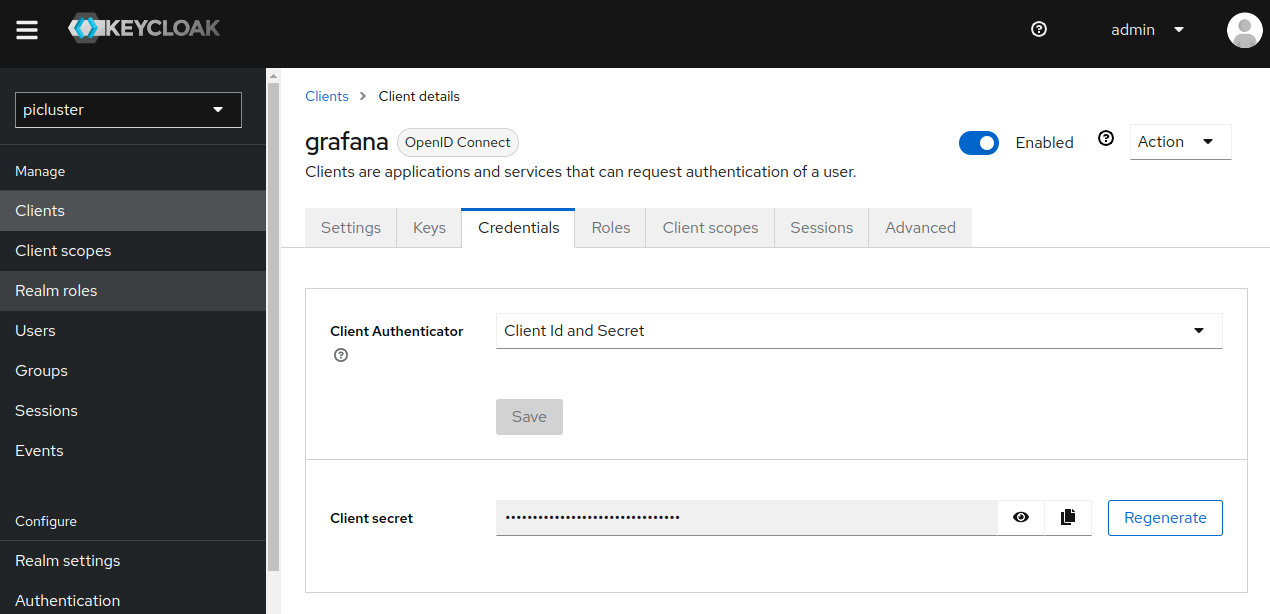
Step 3: Locate grafana client credentials
Under the Credentials tab you will now be able to locate grafana client’s secret.
-
Step 4: Configure Grafana client roles

- Create following roles
- admin
- editor
- viewer
- Create following roles
-
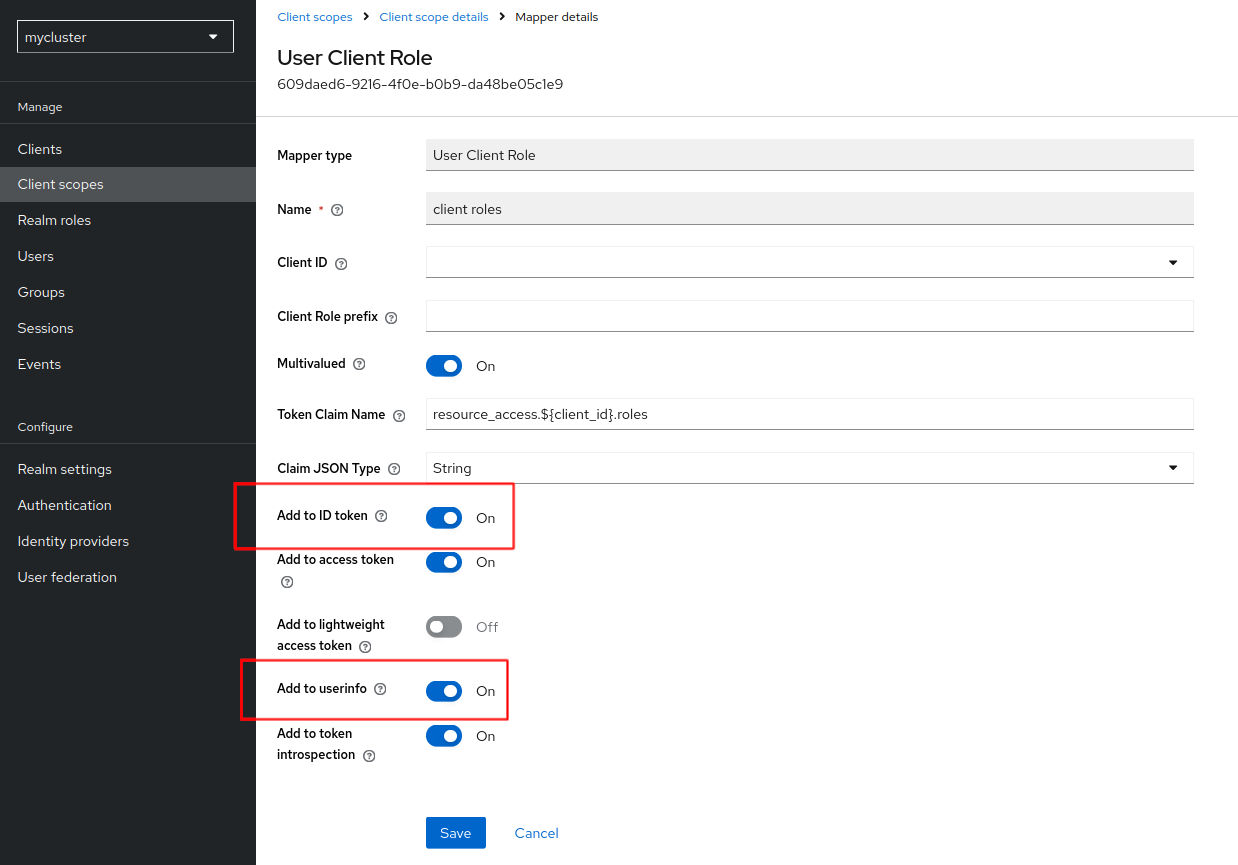
Step 5: Configure
rolesclient scope Configure global clientscopeso, roles are added not only to access tokens, default configuration, but to id tokens and user info,. Go to Client Scopes, and openrolesclient scope detailsGo to Mappers tab and edit
client-rolesmapper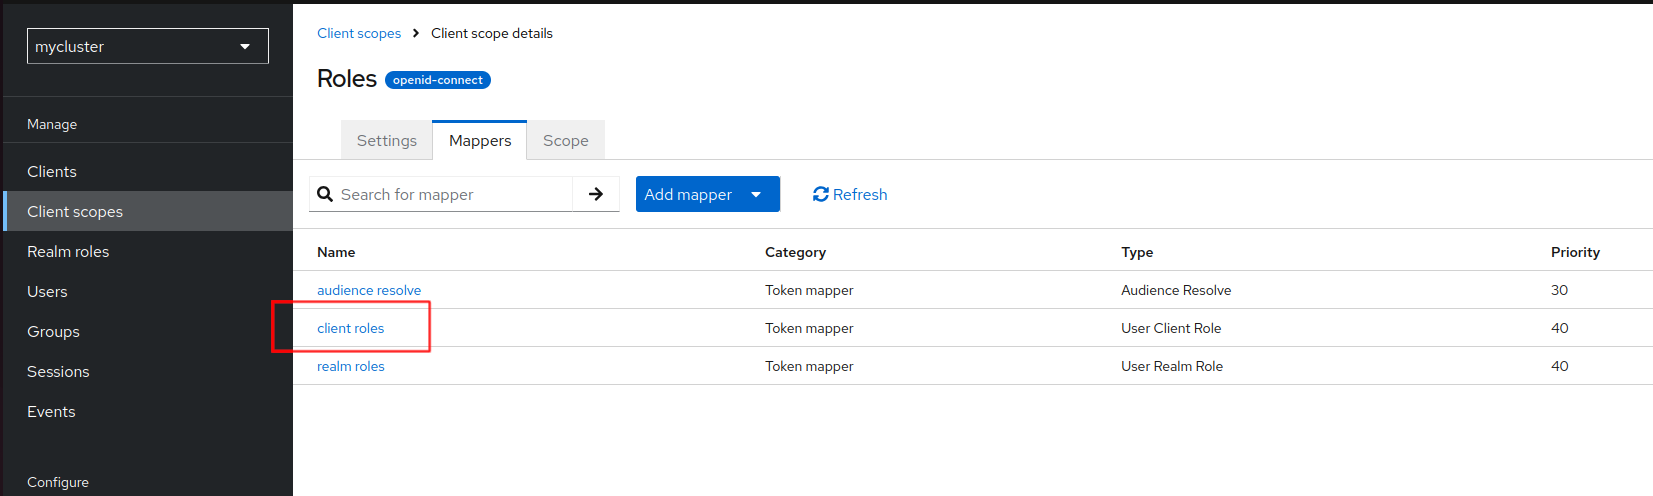
Set to ON the options “Add to ID Token” and “Add to User info”
-
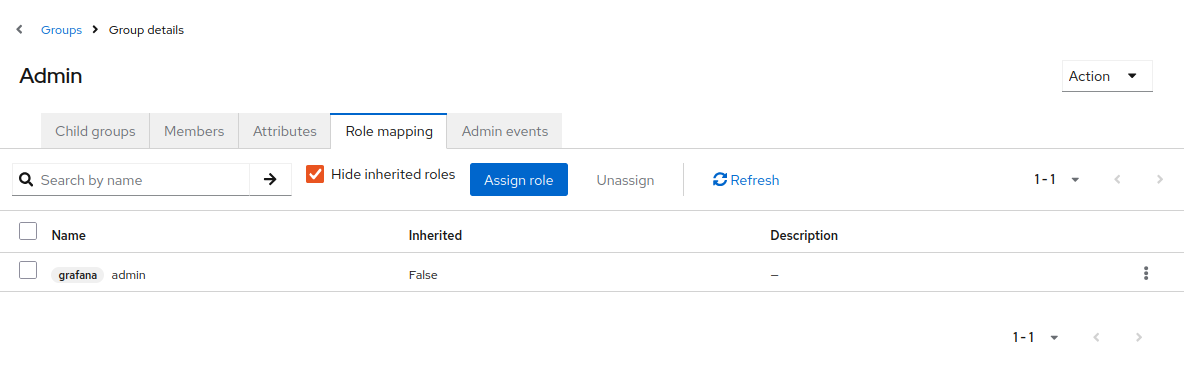
Create different user groups and assign one of previous grafana’s roles (admin, viewer or editor) Go to “Groups” -> “Create Group” For example create admin group and assign Grafana’s admin role.
Add to group grafana’s admin role
-
Create user and add user to Admin group
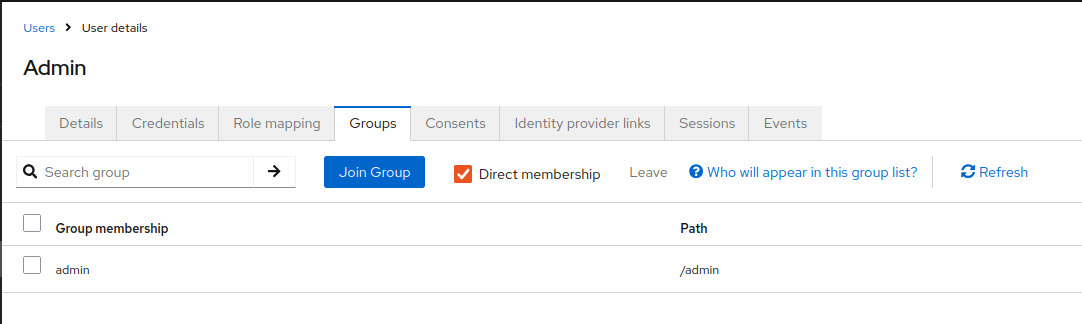
- Step 5: Create user and associate any of the roles created in Step 1
Grafana SSO configuration
Create a secret containing environment variable GF_AUTH_GENERIC_OAUTH_CLIENT_SECRET (OAuth2.0 client credential)
apiVersion: v1
kind: Secret
metadata:
  name: grafana-env-secret
  namespace: grafana
type: Opaque
data:
  GF_AUTH_GENERIC_OAUTH_CLIENT_SECRET: < grafana-client-secret | b64encode>
Where grafana-client-secret is obtained from keycloak client configuration: step 3.
Add the following configuration to grafana helm chart
# Load environment variables from secret
envFromSecret: grafana-env-secret
grafana.ini:
  server:
    # Configuring /grafana subpath
    domain: monitoring.${CLUSTER_DOMAIN}
    root_url: "https://%(domain)s/grafana/"
    # rewrite rules configured in nginx rules
    # https://grafana.com/tutorials/run-grafana-behind-a-proxy/
    serve_from_sub_path: false
  # SSO configuration
  auth.generic_oauth:
    enabled: true
    name: Keycloak-OAuth
    allow_sign_up: true
    # client id and secret
    client_id: grafana
    # client_secret: It has to be configured as environemnt variable GF_AUTH_GENERIC_OAUTH_CLIENT_SECRET
    # scopes
    scopes: openid email profile offline_access roles
    # Enable refresh token
    use_refresh_token: true
    # Configure Grafana's user attributtes from ID token claims
    email_attribute_path: email
    login_attribute_path: username
    name_attribute_path: full_name
    # Auth endpoint
    auth_url: https://iam.${CLUSTER_DOMAIN}/realms/picluster/protocol/openid-connect/auth
    # Token endpoint
    token_url: https://iam.${CLUSTER_DOMAIN}/realms/picluster/protocol/openid-connect/token
    # User info endpoint
    api_url: https://iam.${CLUSTER_DOMAIN}/realms/picluster/protocol/openid-connect/userinfo
    # Configure role mappings from ID token claims
    role_attribute_path: contains(resource_access.grafana.roles[*], 'admin') && 'Admin' || contains(resource_access.grafana.roles[*], 'editor') && 'Editor' || (contains(resource_access.grafana.roles[*], 'viewer') && 'Viewer')
    # Enables single logout
    signout_redirect_url: https://iam.${CLUSTER_DOMAIN}/realms/picluster/protocol/openid-connect/logout?client_id=grafana&post_logout_redirect_uri=https%3A%2F%2Fmonitoring.${CLUSTER_DOMAIN}%2Fgrafana%2Flogin%2Fgeneric_oauth
Note:
Substitute variables (${var}) in the above yaml file before deploying manifest.
- Replace
${CLUSTER_DOMAIN}by the domain name used in the cluster. For example:homelab.ricsanfre.com.
client_secretis obtained from keycloak client configuration: step 3. It has to be configured as a secret- Single logout is configured:
signout_redirect_url - Roles mappings are configured (
role_attribute_path) to use Grafana’s client roles configured in Keycloak - Refresh tokens use is enabled:
offline_accessscope has ben added toauth.generic.oauth.scopesandauth.generic.oauth.use_refresh_tokenis set to true
See configuration details about all options that can be provided in grafana.ini in Grafana Documentation - Configure Oauth authentication
Observability
Metrics
By default Grafana exposes Prometheus metrics at /metrics. This is exposed by default.
Kube-Prometheus-Stack automatically configures Prometheus to monitor Grafana
Important: About Prometheus Integration when configuring Grafana to run behind a Proxy under a subpath
When serve_from_subpath is enabled, internal requests from e.g. prometheus get redirected to the defined root_url.
This is making prometheus not to be able to scrape metrics because it accesses grafana via the kubernetes service name and is then redirected to the public url.
To make Prometheus work, server_from_sub_path must be set to false and a rewrite rule need to be added to NGINX proxy.
See details in this grafana issue
The following Grafana Helm chart configuration should be added in this case, setting server_from_sub_path to false, and configuring the corresponding rewrite rule adding nginx.ingress.kubernetes.io/rewrite-target annotation to the ingress resource.
grafana.ini:
  server:
    domain: monitoring.${CLUSTER_DOMAIN}
    root_url: "%(protocol)s://%(domain)s:%(http_port)s/grafana/"
    # When serve_from_subpath is enabled, internal requests from e.g. prometheus get redirected to the defined root_url.
    # This is causing prometheus to not be able to scrape metrics because it accesses grafana via the kubernetes service name and is then redirected to the public url
    # To make Prometheus work, disable server_from_sub_path and add rewrite rule in NGINX proxy
    # ref: https://github.com/grafana/grafana/issues/72577#issuecomment-1682277779
    serve_from_sub_path: false

# Ingress configuration
ingress:
  enabled: true
  ingressClassName: nginx
  # Values can be templated
  annotations:
    # Enable cert-manager to create automatically the SSL certificate and store in Secret
    cert-manager.io/cluster-issuer: ca-issuer
    cert-manager.io/common-name: monitoring.${CLUSTER_DOMAIN}
    # Nginx rewrite rule
    nginx.ingress.kubernetes.io/rewrite-target: /$1
  path: /grafana/?(.*)
  pathType: ImplementationSpecific
  hosts:
    - monitoring.${CLUSTER_DOMAIN}
  tls:
    - hosts:
      - monitoring.${CLUSTER_DOMAIN}
      secretName: monitoring-tls
Substitute variables (${var}) in the above yaml file before deploying manifest.
- Replace
${CLUSTER_DOMAIN}by the domain name used in the cluster. For example:homelab.ricsanfre.com.