Log aggregation and distribution (Fluentd)
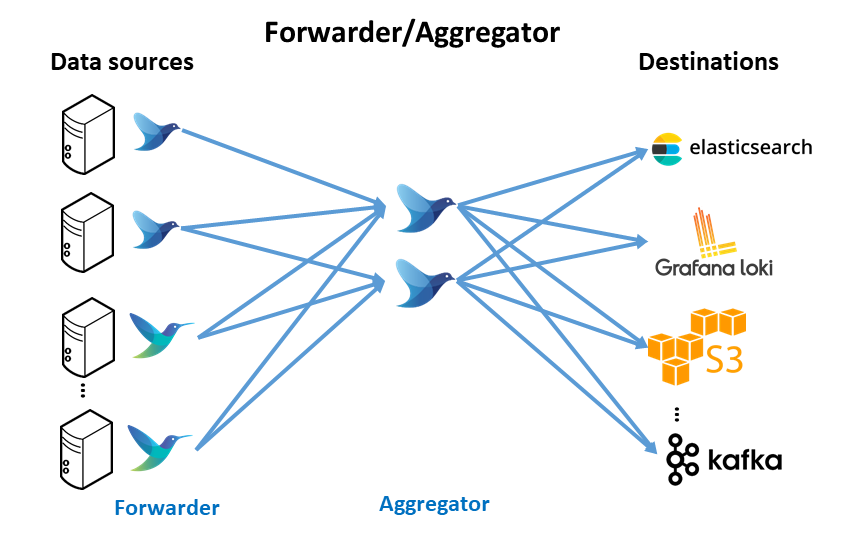
Fluentd is deploy as log aggregator, collecting all logs forwarded by Fluentbit agent and routing all logs to different backends (i.e ElasticSearch, Loki, Kafka, S3 bucket).
What is Fluentd ?
Fluentd is an opensource log collection filtering and distribution tool.
Fluent-bit is a CNCF graduated project
Fluentd as log aggregator/distributor
Fluentd will be deployed as a log distribution instead of fluent-bit because it provides a richer set of plugins to connect sources and destinations and to transform the logs. Particulary when using ElastiSearch as output, fluentd’s elasticsearch output plugin offers more capabilities, ILM and index template management, that the corresponding fluent-bit elasticsearch plugin.
How does Fluentd work?
Fluent-bit and fluentd has a very simillar approach in the way logs are processed and routed, how the data pipelines are defined and using a plugin-based architecture (input, parsers, filters and output plugins)
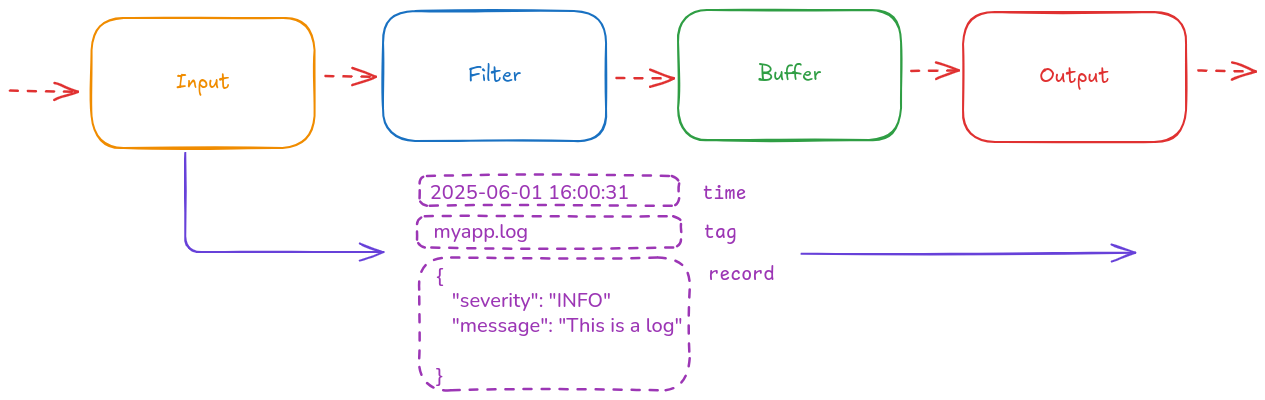
A Fluentd event consists of three components:
tag: Specifies the origin where an event comes from. It is used for message routing.time: Specifies the time when an event happens with nanosecond resolution.record: Specifies the actual log as a JSON object.
Fluentd data pipelines
Fluentd collects and process logs (also known as records) from different input sources, then parses and filters these records before they’re stored. After data is processed and in a safe state, meaning either in memory or in the file system, the records are routed through the proper output destinations.
graph LR;
  input-->parser
  parser-->filter
  filter-->storage[buffering]
  storage-->router((router))
  router-->output1([output1])
  router-->output2([output2])
  router-->output3([outputN])

  classDef box fill:#326ce5,stroke:#fff,stroke-width:0px,color:#000;
  class input,parser,filter,storage,router,output1,output2,output3 box;
  %%{init: {'themeVariables': { 'lineColor': 'red'}}}%%
Installing Fluentd
Building customized fluentd image
Fluentd official images do not contain any of the required plugins (elasticsearch, prometheus monitoring, etc.).
There are prebuild available fluentd images for kubernetes, but they are customized to parse kubernetes logs (deploy fluentd as forwarder and not as aggregator) and there are different images per output plugin (one for elasticsearch, one for kafka, etc.)
Since I am currently dispatching logs to 2 different destinations (ElasticSearch and Loki) and in the future I might configure the aggregator to dispatch logs to another source (i.e Kafka for building a analytics Data Pipeline), I have decided to build a customized fluentd image with just the plugins I need, and containing default configuration to deploy fluentd as aggregator.
Tip:
fluentd-kubernetes-daemonset images should work for deploying fluentd as Deployment. For outputing to the ES you just need to select the adequate fluentd-kubernetes-daemonset image tag.
As alternative, you can create your own customized docker image or use mine. You can find it in ricsanfre/fluentd-aggregator GitHub repository. The multi-architecture (amd64/arm64) image is available in docker hub:
ricsanfre/fluentd-aggregator:v1.17.1-debian-1.0
As base image, the official fluentd docker image can be used. To customize it, follow the instructions in the project repository: “Customizing the image to intall additional plugins”.
In our case, the list of plugins that need to be added to the default fluentd image are:
-
fluent-plugin-elasticsearch: ES as backend for routing the logs. This plugin supports the creation of index templates and ILM policies associated to them during the process of creating a new index in ES. -
fluent-plugin-prometheus: Enabling prometheus monitoring -
fluent-plugin-record-modifier: record_modifier filter faster and lightweight than embedded transform_record filter. -
fluent-plugin-grafana-loki: enabling Loki as destination for routing the logs
Additionally default fluentd config can be added to the customized docker image, so fluentd can be configured as log aggregator, collecting logs from forwarders (fluentbit/fluentd) and routing all logs to elasticsearch.
This fluentd configuration in the docker image can be overwritten when deploying the container in kubernetes, using a ConfigMap mounted as a volume, or when running with docker run, using a bind mount. In both cases the target volume to be mounted is where fluentd expects the configuration files (/fluentd/etc in the official images).
Important:
fluent-plugin-elasticsearch plugin configuration requires to set a specific sniffer class for implementing reconnection logic to ES(sniffer_class_name Fluent::Plugin::ElasticsearchSimpleSniffer). See plugin documentation fluent-plugin-elasticsearh: Sniffer Class Name.
The path to the sniffer class need to be passed as parameter to fluentd command (-r option), otherwise the fluentd command will give an error
Docker’s entrypoint.sh in the customized image has to be updated to automatically provide the path to the sniffer class.
# First step looking for the sniffer ruby class within the plugin
SIMPLE_SNIFFER=$( gem contents fluent-plugin-elasticsearch | grep elasticsearch_simple_sniffer.rb )

# Execute fluentd command with -r option for loading the required ruby class
fluentd -c ${FLUENTD_CONF} ${FLUENTD_OPT} -r ${SIMPLE_SNIFFER}
Customized image Dockerfile could look like this:
ARG BASE_IMAGE=fluent/fluentd:v1.17.1-debian-1.0


FROM $BASE_IMAGE

## 1- Update base image installing fluent plugins. Executing commands `gem install <plugin_name>`

# Use root account to use apk
USER root

RUN buildDeps="sudo make gcc g++ libc-dev" \
 && apt-get update \
 && apt-get install -y --no-install-recommends $buildDeps \
 && sudo gem install fluent-plugin-elasticsearch -v '~> 5.4.3' \
 && sudo gem install fluent-plugin-prometheus -v '~> 2.2' \
 && sudo gem install fluent-plugin-record-modifier -v '~> 2.2'\
 && sudo gem install fluent-plugin-grafana-loki -v '~> 1.2'\
 && sudo gem sources --clear-all \
 && SUDO_FORCE_REMOVE=yes \
    apt-get purge -y --auto-remove \
                  -o APT::AutoRemove::RecommendsImportant=false \
                  $buildDeps \
 && rm -rf /var/lib/apt/lists/* \
 && rm -rf /tmp/* /var/tmp/* /usr/lib/ruby/gems/*/cache/*.ge

## 2) (Optional) Copy customized fluentd config files (fluentd as aggregator)

COPY ./conf/fluent.conf /fluentd/etc/
COPY ./conf/forwarder.conf /fluentd/etc/
COPY ./conf/prometheus.conf /fluentd/etc/

## 3) Modify entrypoint.sh to configure sniffer class
COPY entrypoint.sh /fluentd/entrypoint.sh

# Environment variables
ENV FLUENTD_OPT=""

## 4) Change to fluent user to run fluentd
# Run as fluent user. Do not need to have privileges to access /var/log directory
USER fluent
ENTRYPOINT ["tini",  "--", "/fluentd/entrypoint.sh"]
CMD ["fluentd"]
Helm Chart Installation
Fluentd won’t not be deployed as privileged daemonset, since it does not need to access to kubernetes logs/APIs.
fluentd official helm chart also supports the deployment of fluentd as Deployment or Statefulset instead of default Daemonset (used when Fluentd collect Kubernetes logs). In case of deploying it as a Deployment, Kubernetes HPA (Horizontal POD Autoscaler) is also supported.
Fluentd aggregator should be deployed in HA, Kubernetes deployment with several replicas. Additionally, Kubernetes HPA (Horizontal POD Autoscaler) should be configured to automatically scale the number of replicas.
Fluentd will be deployed as Kubernetes Deployment (not default as Daemonset), enabling multiple PODs service replicas, so it can be accessible by Fluentbit pods.
Since it does not need to access neither host directories for collecting logs or Kubernetes API to enrich the collected logs, all default privileges when installing as a DaemonSet, will be removed.
Fluentd will be deployed using Fluentd’s community helm chart but using as a prerequisite the following Kubernetes resources:
-
Cert-manager’s
Certificateresource: so certmanager can generate automatically a Kubernetes TLS Secret resource containing fluentd’s TLS certificate to secure communications between Fluent-bit and Fluentd (Forward protocol). -
Kubernetes
ConfigMapresources containing fluentd configuration. Instead of using default configMaps provided by Helm-chart. -
Kubernetes
Secretresource to store all secrets needed (i.e: forward protocol shared secret, elasticsearch credentials etc) -
Kubernetes
ConfigMapresources containing ElasticSearch’s index templates definitions.
Installation process is the following:
-
Step 1: Create fluent namespace (if it has not been previously created)
kubectl create namespace fluent -
Step 2: Create Config Maps containing fluentd configuration files
---
apiVersion: v1
kind: ConfigMap
metadata:
  name: fluentd-main-config
  namespace: fluent
data:
  fluent.conf: |-
    # Include conf files in config.d directory
    @include config.d/*.conf

---
apiVersion: v1
kind: ConfigMap
metadata:
  name: fluentd-extra-files
  namespace: fluent
data:
  01_sources.conf: |-
    # Sources Configuration
  02_filters.conf: |-
    # Filters configuration
  03_output.conf: |-
    # output configurations
Note: Previous configuration is incomplete, check sections below to get a complete
fluent.confconfiguration to be applied to the cluster. -
Step 3. Create fluentd TLS certificate to secure communication between fluent-bit and fluentd (forwarder protocol).
To configure fluentd to use TLS, the path to the files containing the TLS certificate and private key need to be provided. The TLS Secret containing the certificate and key can be mounted in fluentd POD in a specific location (
/etc/fluent/certs), so fluentd proccess can use them.Certmanager’s ClusterIssuer
ca-issuer, created during certmanager installation, can be used to generate automatically fluentd’s TLS Secret automatically.Create the Certificate resource:
apiVersion: cert-manager.io/v1
kind: Certificate
metadata:
  name: fluentd-tls
  namespace: fluent
spec:
  # Secret names are always required.
  secretName: fluentd-tls
  duration: 2160h # 90d
  renewBefore: 360h # 15d
  commonName: fluentd.${CLUSTER_DOMAIN}
  isCA: false
  privateKey:
    algorithm: ECDSA
    size: 256
  usages:
    - server auth
    - client auth
  dnsNames:
    - fluentd.${CLUSTER_DOMAIN}
  isCA: false
  # ClusterIssuer: ca-issuer.
  issuerRef:
    name: ca-issuer
    kind: ClusterIssuer
    group: cert-manager.io
Note:
Substitute variables (
${var}) in the above yaml file before deploying manifest.- Replace
${CLUSTER_DOMAIN}by the domain name used in the cluster. For example:homelab.ricsanfre.com
Then, Certmanager automatically creates a Secret like this:
apiVersion: v1 kind: Secret metadata: name: fluentd-tls namespace: fluent type: kubernetes.io/tls data: ca.crt: <ca cert content base64 encoded> tls.crt: <tls cert content base64 encoded> tls.key: <private key base64 encoded> - Replace
-
Step 4. Create Secret containing Fluentd’s credentials (Forward protocol shared key, ElasticSearch credentials, etc.)
Generate base64 encoded shared key
echo -n 'supersecret' | base64Create a Secret
fluentd-secretscontaining all secrets (fluent shared key, elastic search user and passworkd)apiVersion: v1 kind: Secret metadata: name: fluent-secrets namespace: fluent type: Opaque data: fluentd-shared-key: <base64 encoded password> es-username: <base64 encoded user name> es-password: <base64 encoded user name>Elastic Search user,
fluentdand its password should match the ones created when installing ElasticSearch. See “ElasticSearch Installation: File-based authentication”. -
Step 5. Create ConfigMap containing ElasticSearch index templates definitions. ElasticSearch Index template definitions are JSON files defining how ElasticSearch maps log’s fields to ElasticSearch data types and the way ElasticSearch indexes these fields. See details in section below.
# ES index template for fluentd logs
apiVersion: v1
kind: ConfigMap
metadata:
  name: fluentd-es-templates
  namespace: fluent
data:
  es-template.json: |-
    {

    }
  es-template2.json: |-
Note: Previous ConfigMap is incomplete, check section below about ElasticSearch Output Plugin to get a complete ConfigMap.
- Step 6. Add fluent helm repo
helm repo add fluent https://fluent.github.io/helm-charts - Step 7. Update helm repo
helm repo update -
Step 8. Create
values.ymlfor tuning helm chart deployment.fluentd configuration can be provided to the helm. See
values.ymlFluentd will be configured with the following helm chart
values.yml:# Fluentd image image: repository: "ricsanfre/fluentd-aggregator" pullPolicy: "IfNotPresent" tag: "v1.17.1-debian-1.0" # Deploy fluentd as deployment kind: "Deployment" # Number of replicas replicaCount: 1 # Enabling HPA autoscaling: enabled: false minReplicas: 1 maxReplicas: 100 targetCPUUtilizationPercentage: 80 # Do not create serviceAccount and RBAC. Fluentd does not need to get access to kubernetes API. serviceAccount: create: false rbac: create: false # fluentd is running as non root user securityContext: capabilities: drop: - ALL readOnlyRootFilesystem: false runAsNonRoot: true runAsUser: 1000 # Do not mount logs directories mountVarLogDirectory: false mountDockerContainersDirectory: false # Environment variables used by Fluent Config files envFrom: - configMapRef: name: fluentd-env-configmap - secretRef: name: fluentd-env-secret # Providing fluentd external configuration # Overriding Default FluentD configuration ## Name of the configMap containing a custom fluentd.conf configuration file to use instead of the default. mainConfigMapNameOverride: fluentd-main-config ## Name of the configMap containing files to be placed under /etc/fluent/config.d/ ## NOTE: This will replace ALL default files in the aforementioned path! extraFilesConfigMapNameOverride: fluentd-extra-files ## Do not create additional config maps ## configMapConfigs: [] # Additional Volumes and VolumeMounts (only tls certificates and shared secrets) volumes: - name: fluentd-tls secret: secretName: fluentd-tls - name: etcfluentd-template configMap: name: fluentd-es-template defaultMode: 0777 volumeMounts: - name: etcfluentd-template mountPath: /etc/fluent/template - mountPath: /etc/fluent/certs name: fluentd-tls readOnly: true # Service. Exporting forwarder port (Metric already exposed by chart) service: type: "ClusterIP" annotations: {} ports: - name: forwarder protocol: TCP containerPort: 24224 ## Fluentd list of plugins to install ## plugins: [] # - fluent-plugin-out-http # Enable prometheus Service Monitor metrics: serviceMonitor: enabled: true additionalLabels: {} prometheusRule: enabled: false dashboards: enabled: "true" labels: grafana_dashboard: '"1"' - Step 9. Install chart
helm install fluentd fluent/fluentd -f values.yml --namespace fluent - Step 10: Check fluentd status
kubectl get all -l app.kubernetes.io/name=fluentd -n fluent
Fluentd chart configuration details
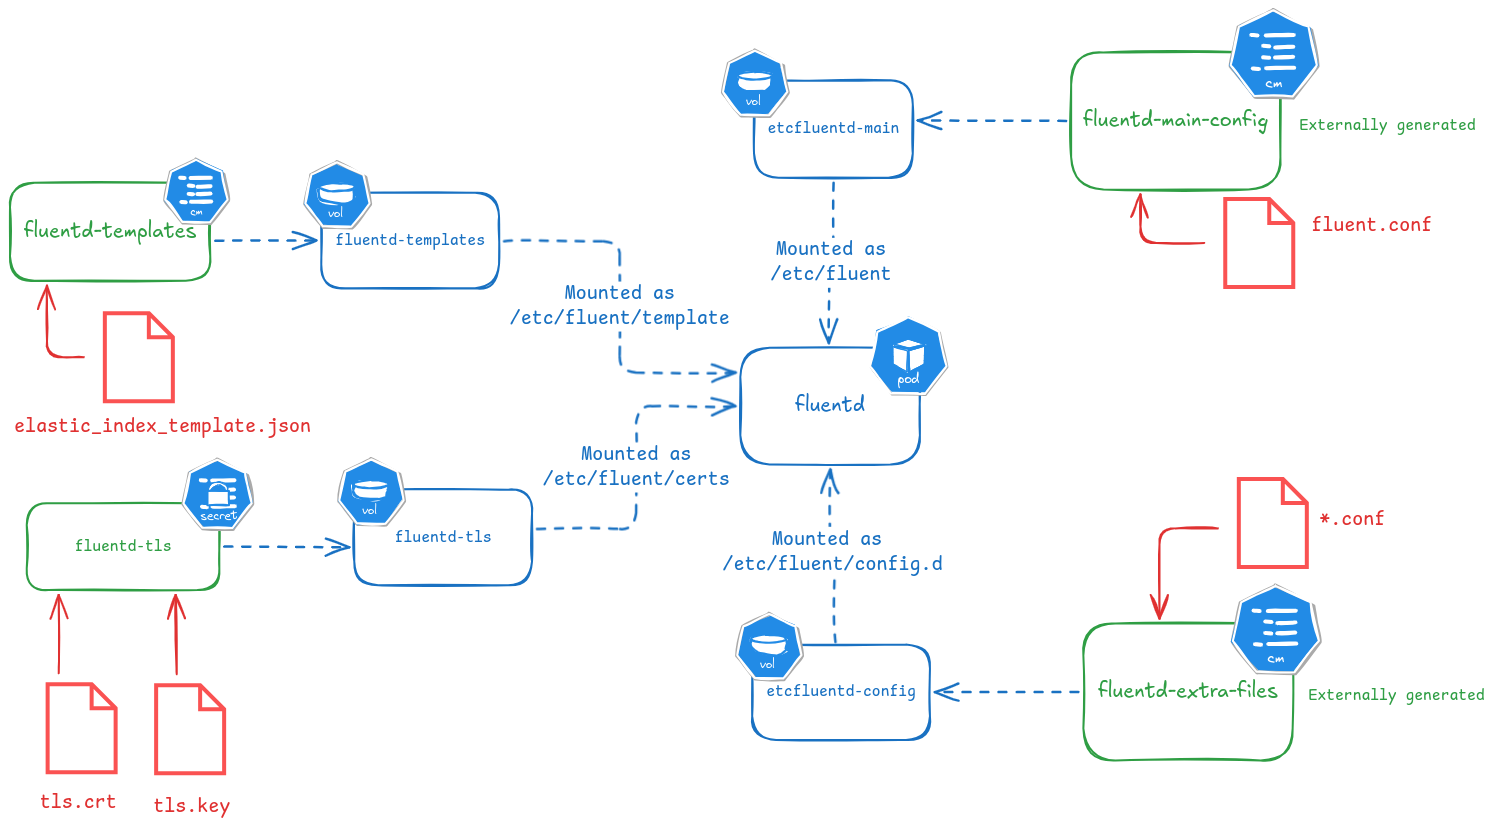
The Helm chart deploy fluentd as a Deployment, passing environment values to the pod and mounting as volumes different ConfigMaps. These ConfigMaps contain the fluentd configuration files and TLS secret used in forward protocol (communication with the fluentbit forwarders).
Fluentd deployed as Deployment
# Fluentd image
image:
  repository: "ricsanfre/fluentd-aggregator"
  pullPolicy: "IfNotPresent"
  tag: "v1.17.1-debian-1.0"

# Deploy fluentd as deployment
kind: "Deployment"

# Number of replicas
replicaCount: 1

# Enabling HPA
autoscaling:
  enabled: true
  minReplicas: 1
  maxReplicas: 100
  targetCPUUtilizationPercentage: 80

# Do not create serviceAccount and RBAC. Fluentd does not need to get access to kubernetes API.
serviceAccount:
  create: false
rbac:
  create: false

# Setting security context. Fluentd is running as non root user
securityContext:
   capabilities:
     drop:
     - ALL
   readOnlyRootFilesystem: false
   runAsNonRoot: true
   runAsUser: 1000
-
Fluentd is deployed as Deployment (
kind: "Deployment") with 1 replica (replicaCount: 1, using custom fluentd image (image.repository: "ricsanfre/fluentd-aggregatorandimage.tag). -
Service account (
serviceAccount.create: false) and corresponding RoleBinding (rbac.create: false) are not created since fluentd aggregator does not need to access to Kubernetes API. -
Security context for the pod (
securityContext), since it is running using a non-root user. -
HPA autoscaling is also configured (
autoscaling.enabling: true).
Fluentd container environment variables.
Fluentd environment variables can be referenced in fluentd configuration file using the #{ENV['VARIABLE_NAME']} syntax (Any ruby code can be ingested usong #{})
Any environment variable used by Fluentd configuration can be provided to Fluentd pod through env and envFrom helm chart value.
## Additional environment variables to set for fluentd pods
env: {}
# env:
#   # Elastic operator creates elastic service name with format cluster_name-es-http
#   - name:  FLUENT_ELASTICSEARCH_HOST
#     value: efk-es-http
#     # Default elasticsearch default port
#   - name:  FLUENT_ELASTICSEARCH_PORT
#     value: "9200"
#   # Elasticsearch user
#   - name: FLUENT_ELASTICSEARCH_USER
#     value: "elastic"
#   # Elastic operator stores elastic user password in a secret
#   - name: FLUENT_ELASTICSEARCH_PASSWORD
#     valueFrom:
#       secretKeyRef:
#         name: "efk-es-elastic-user"
#         key: elastic
#   # Fluentd forward security
#   - name: FLUENTD_FORWARD_SEC_SHARED_KEY
#     valueFrom:
#       secretKeyRef:
#         name: fluentd-shared-key
#         key: fluentd-shared-key
#   # Loki url
#   - name: LOKI_URL
#     value: "http://loki-gateway"
#   # Loki username
#   - name: LOKI_USERNAME
#     value: ""
#   # Loki password
#   - name: LOKI_PASSWORD
#     value: ""

# Environment variables used by Fluent Config files
envFrom: {}
# envFrom:
#   - configMapRef:
#       name: fluentd-env-configmap
#   - secretRef:
#       name: fluentd-env-secret
fluentd docker image and configuration files use the following environment variables:
-
Path to main fluentd config file (
FLUENTD_CONF) pointing at/etc/fluent/fluent.conffile.Note:
FLUENTD_CONFenvironment variable is automatically by Helm Chart. Not need to be specified in Helm Chartvalues.yaml -
Elasticsearch output plugin configuration:
-
ES connection details (
FLUENT_ELASTICSEARCH_HOSTandFLUENT_ELASTICSEARCH_PORT): elasticsearch kubernetes service (efk-es-http) and ES port. -
ES access credentials (
FLUENT_ELASTICSEARCH_USERandFLUENT_ELASTICSEARCH_PASSWORD): elastic user password obtained from the corresponding Secret (efk-es-elastic-usercreated during ES installation)
-
-
Loki output plugin configuration
- Loki connection details (
LOKI_URL). URL of the gateway component:loki-gatewayservice installed in the same namespace (logging). - Loki authentication credentials (
LOKI_USERNAMEandLOKI_PASSWORD). By default authentication is not configured in loki-gateway, so this credentials can be null.
- Loki connection details (
-
Forwarder input plugin configuration:
- Shared key used for authentication(
FLUENTD_FORWARD_SEC_SHARED_KEY), loading the content of the secret generated in step 2 of installation procedure:fluentd-shared-key.
- Shared key used for authentication(
Fluentd POD additional volumes and volume mounts
By default helm chart mount ConfigMaps containing the fluentd configuration
Additionally volumes for ES templates and TLS certificates need to be configure and container logs directories volumes should be not mounted (fluentd is not reading container logs files).
# Do not mount logs directories
mountVarLogDirectory: false
mountDockerContainersDirectory: false

# Providing fluentd external configuration
# Overriding Default FluentD configuration
## Name of the configMap containing a custom fluentd.conf configuration file to use instead of the default.
mainConfigMapNameOverride: fluentd-main-config
## Name of the configMap containing files to be placed under /etc/fluent/config.d/
## NOTE: This will replace ALL default files in the aforementioned path!
extraFilesConfigMapNameOverride: fluentd-extra-files

## Do not create additional config maps
##
configMapConfigs: []

# Volumes and VolumeMounts (only ES template files and TLS certificates)
volumes:
  - name: etcfluentd-template
    configMap:
      name: fluentd-es-template
      defaultMode: 0777
  - name: fluentd-tls
    secret:
      secretName: fluentd-tls

volumeMounts:
  - name: etcfluentd-template
    mountPath: /etc/fluent/template
  - mountPath: /etc/fluent/certs
    name: fluentd-tls
    readOnly: true
-
mountVarLogDirectoryandmountDockerContainerDirectoryset to false so host directories containing logs are not mounted. Fluentd does not need to get access to logs -
mainConfigMapNameOverrideandextraFilesConfigMapOverride: configMaps containing fluentd configuration files are externally provided and helm chart does not create its own default configuration. This configMaps are mounted as/etc/fluentand/etc/fluent/config.d -
volumesandvolumesMountsspecifies additional volumes to be mounted into fluentd POD.- Secret
fluentd-tls, generated in step 1 of the installation procedure, containing fluentd certificate and key. TLS Secret containing fluentd’s certificate and private key files, is mounted as/etc/fluent/certs. - ConfigMap
fluentd-template, containing ES index templates used byfluentd-elasticsearch-plugin, mounted as/etc/fluent/template. This configMap is generated in step 3 of the installation procedure.
- Secret
ConfigMaps created by the helm chart are mounted in the fluentd container:
-
ConfigMap
fluentd-main-config, created by default by helm chart, containing fluentd main config file (fluent.conf), is mounted as/etc/fluentvolume. -
ConfigMap
fluentd-extra-files, created by default by helm chart, containing fluentd config files included by main config file is mounted as/etc/fluent/config.d
Exposing Fluentd Forwarding port
By default Helm Chart creates a Kubernetes Service exposing only Prometheus /metrics endoint in port 24231.
The following configuration is needed so forwarder port is also exposed also in port 24224
# Service. Exporting forwarder port (Metric already exposed by chart)
service:
  type: "ClusterIP"
  annotations: {}
  ports:
  - name: forwarder
    protocol: TCP
    containerPort: 24224
FLuentd plugins to install
## Fluentd list of plugins to install
##
plugins: []
# - fluent-plugin-out-http
The helm chart can be also configured to install fluentd plugins on start-up (plugins).
If a list of plugins is provided, before starting fluentd the plugins specified will be installed executing command fluent-gem install <plugin_name>
Configuring Fluentd
A Fluentd data-pipelines will be configured to collect logs from fluentbit forwarders and route them to different destinations (i.e. ElasticSearch, Loki, etc.)
Data pipeline to be configured in this case is the following:
graph LR;
  fluentbit[fluentbit]--> forward
  forward["**forward**
label=@FORWARD"] -- tag: kube.var.log.containers.fluentd -->relabel1
  forward -- tag: kube.** -->filter1
  relabel1["**relabel**
label=@DISCARD"]-->null
  filter1[**modify**]--> relabel2
  relabel2["**relabel**
label=@DISPATCH"] --> copy
  copy[**copy**] --> relabel3
  copy --> relabel4
  relabel3["**relabel**
label=@OUTPUT_ES"]--> output1
  relabel4["**relabel**
label=@OUTPUT_LOKI"]--> output2
  output1[elastic]--> elastic[(elasticsearch)]
  output2[loki]--> loki[(loki)]
  subgraph input
    forward
  end
  subgraph filters
    filter1
  end
  subgraph output
    relabel1
    relabel2
    relabel3
    relabel4
    null
    copy
    output1
    output2
  end
  linkStyle default stroke:#e59d32,stroke-width:2px,color:#white
  classDef out fill:#ddd,stroke:green,stroke-width:4px,color:green;
  classDef in fill:#ddd,stroke:green,stroke-width:4px,color:green;
  classDef box fill:#326ce5,stroke:none,stroke-width:0px,color:#white;
  classDef group fill:none,stroke:#e53232,stroke-width:2px,color:#e53232;
  class forward,filter1,relabel1,relabel2,relabel3,relabel4,filter4,filter5,copy,null,output1,output2 box;
  class elastic,loki out;
  class fluentbit in;
  class input,filters,output group;
The following fluentd configuration files are used:
/etc/fluent/
├── fluent.conf
└── config.d
    ├── 01_sources.conf
    ├── 02_filters.conf
    ├── 03_dispatch.conf
    └── 04_output.conf
fluent.conf## Fluentd main configuration file # Include conf files in config.d directory @include config.d/*.confMain configuration file simple includes all configuration files located in
/etc/fluent/config.ddirectory-
config.d/01_sources.conf## FluentD config file ## Sources ## ## logs from fluentbit forwarders <source> @type forward @label @FORWARD bind "#{ENV['FLUENTD_FORWARD_BIND'] || '0.0.0.0'}" port "#{ENV['FLUENTD_FORWARD_PORT'] || '24224'}" # Enabling TLS <transport tls> cert_path /etc/fluent/certs/tls.crt private_key_path /etc/fluent/certs/tls.key </transport> # Enabling access security <security> self_hostname "#{ENV['FLUENTD_FORWARD_SEC_SELFHOSTNAME'] || 'fluentd-aggregator'}" shared_key "#{ENV['FLUENT_AGGREGATOR_SHARED_KEY'] || 'sharedkey'}" </security> </source> ## Enable Prometheus end point <source> @type prometheus @id in_prometheus bind "0.0.0.0" port 24231 metrics_path "/metrics" </source> <source> @type prometheus_monitor @id in_prometheus_monitor </source> <source> @type prometheus_output_monitor @id in_prometheus_output_monitor </source>Configuration files defining fluentd sources
With this configuration, fluentd:
-
Collects logs from forwarders (port 24224) configuring forward input plugin. TLS (
<transport>) and authentication (<security>) is configured. -
Enables Prometheus metrics exposure (port 24231) configuring prometheus input plugin. Complete list of configuration parameters in fluent-plugin-prometheus repository
-
Labels (
@FORWARD) all incoming records from fluent-bit forwarders to perform further processing and routing.
-
-
config.d/02_filters.conf## ## Filters ## <label @FORWARD> # Re-route fluentd logs <match kube.var.log.containers.fluentd**> @type relabel @label @FLUENT_LOG </match> ## Additional Filters/Transformations can be added here # <filter kube.**> # @type record_modifier # remove_keys key1, key2 # <record> # </record> # </filter> <match **> @type relabel @label @DISPATCH </match> </label>With this configuration, fluentd:
-
Relabels (
@FLUENT_LOG) logs coming from fluentd itself to re-route them (discard them). -
Relabels (
@DISPATCH), the rest of logs to be dispatched to the outputs -
Additional filters could be added here to transform the data. Initially all transformations have been included at the source (Fluent-bit)
-
-
config.d/03_dispatch.conf# Discard FLUENTD LOGS <label @FLUENT_LOG> <match **> @type null @id ignore_fluent_logs </match> </label> # Dispatch logs to different destinations <label @DISPATCH> # Calculate prometheus metrics <filter **> @type prometheus <metric> name fluentd_input_status_num_records_total type counter desc The total number of incoming records <labels> tag ${tag} hostname ${host} </labels> </metric> </filter> # Copy log stream to different outputs <match **> @type copy <store> @type relabel @label @OUTPUT_ES </store> <store> @type relabel @label @OUTPUT_LOKI </store> </match> </label>With this configuration, fluentd:
- Discards fluentd logs (labeled before as @FLUENTLOG) using
nulloutput plugin - Counts per tag and hostname all incoming records so a corresponding prometheus metric can be provided:
fluentd_input_status_num_records_total - Copy log stream to route to two differents stores and relabel them so logs can be routed to two different destinations (ElasticSearch and Loki).
- Discards fluentd logs (labeled before as @FLUENTLOG) using
-
config.d/04_output.conf# # Output # # Elastic Search Output <label @OUTPUT_ES> # Setup index name. Index per namespace or per container <filter kube.**> @type record_transformer enable_ruby <record> index_name ${record['namespace']} </record> </filter> <filter host.**> @type record_transformer enable_ruby <record> index_name "host" </record> </filter> # Send received logs to elasticsearch <match **> @type elasticsearch @id out_es @log_level info include_tag_key true host "#{ENV['FLUENT_ELASTICSEARCH_HOST']}" port "#{ENV['FLUENT_ELASTICSEARCH_PORT']}" scheme http user "#{ENV['FLUENT_ELASTICSEARCH_USER'] || use_default}" password "#{ENV['FLUENT_ELASTICSEARCH_PASSWORD'] || use_default}" # Reload and reconnect options reconnect_on_error true reload_on_failure true reload_connections false # HTTP request timeout request_timeout 15s # Log ES HTTP API errors log_es_400_reason true # avoid 7.x errors suppress_type_name true # setting sniffer class sniffer_class_name Fluent::Plugin::ElasticsearchSimpleSniffer # Do not use logstash format logstash_format false # Setting index_name index_name fluentd-${index_name} # specifying time key time_key time # including @timestamp field include_timestamp true # ILM Settings - WITH ROLLOVER support # https://github.com/uken/fluent-plugin-elasticsearch/blob/master/README.Troubleshooting.md#enable-index-lifecycle-management index_date_pattern "" enable_ilm true ilm_policy_id fluentd-policy ilm_policy {"policy":{"phases":{"hot":{"min_age":"0ms","actions":{"rollover":{"max_size":"10gb","max_age":"7d"}}},"warm":{"min_age":"2d","actions":{"shrink":{"number_of_shards":1},"forcemerge":{"max_num_segments":1}}},"delete":{"min_age":"7d","actions":{"delete":{"delete_searchable_snapshot":true}}}}}} ilm_policy_overwrite true # index template use_legacy_template false template_overwrite true template_name fluentd-${index_name} template_file "/etc/fluent/template/fluentd-es-template.json" customize_template {"<<shard>>": "1","<<replica>>": "0", "<<TAG>>":"${index_name}"} remove_keys index_name <buffer tag, index_name> flush_thread_count "#{ENV['FLUENT_ELASTICSEARCH_BUFFER_FLUSH_THREAD_COUNT'] || '8'}" flush_interval "#{ENV['FLUENT_ELASTICSEARCH_BUFFER_FLUSH_INTERVAL'] || '5s'}" chunk_limit_size "#{ENV['FLUENT_ELASTICSEARCH_BUFFER_CHUNK_LIMIT_SIZE'] || '2M'}" queue_limit_length "#{ENV['FLUENT_ELASTICSEARCH_BUFFER_QUEUE_LIMIT_LENGTH'] || '32'}" retry_max_interval "#{ENV['FLUENT_ELASTICSEARCH_BUFFER_RETRY_MAX_INTERVAL'] || '30'}" retry_forever true </buffer> </match> </label> # Loki Output <label @OUTPUT_LOKI> <match **> @type loki @id out_loki_kube @log_level info url "#{ENV['LOKI_URL']}" username "#{ENV['LOKI_USERNAME'] || use_default}" password "#{ENV['LOKI_PASSWORDD'] || use_default}" extra_labels {"job": "fluentd"} line_format json <label> app container pod namespace host filename </label> <buffer> flush_thread_count 8 flush_interval 5s chunk_limit_size 2M queue_limit_length 32 retry_max_interval 30 retry_forever true </buffer> </match> </label>With this configuration fluentd:
-
Routes all logs to elastic search using elasticsearch output plugin. Complete list of parameters in fluent-plugin-elasticsearch repository.
-
Routes all logs to Loki using loki output plugin. It adds the following labels to each log stream: app, pod, container, namespace, node_name and job.
-
Note: All these files should be put together into a ConfigMap. [TODO] Add reference to ConfigMap in github repo.
Forward Input Plugin
<source>
    @type forward
    @label @FORWARD
    bind "#{ENV['FLUENTD_FORWARD_BIND'] || '0.0.0.0'}"
    port "#{ENV['FLUENTD_FORWARD_PORT'] || '24224'}"
    # Enabling TLS
    <transport tls>
        cert_path /etc/fluent/certs/tls.crt
        private_key_path /etc/fluent/certs/tls.key
    </transport>
    # Enabling access security
    <security>
        self_hostname "#{ENV['FLUENTD_FORWARD_SEC_SELFHOSTNAME'] || 'fluentd-aggregator'}"
        shared_key "#{ENV['FLUENT_AGGREGATOR_SHARED_KEY'] || 'sharedkey'}"
    </security>
</source>
- Fluentd to expose
forwardprotocol on port 24224 (by default unlessFLUEND_FORWARD_PORTvariable is specified) - TLS communication is enabled for
forwardprotocol. Fluentd TLS certificate and private key are read from filesystem (ConfigMap is mounted as volume) - Authentication is configured using shared_key
Syslog Input Plugin
<source>
  @type syslog
  @label @FORWARD
  tag host
  bind 0.0.0.0
  port 5140
  protocol_type udp
  <parse>
    message_format rfc3164
  </parse>
<source>
- Fluentd to expose
syslogprotocol on port 5140 - Input messages are parsed using embedded rfc3164 syslog parser (i.e. OpenWRT generates syslog messages following that format)
ElasticSearch Output Configuration
Basic configuration
Output plugin is configured with following detils
<label @OUTPUT_ES>
    <match **>
        @type elasticsearch
        # ...
        # Log ES HTTP API errors
        log_es_400_reason true
        # avoid 7.x errors
        suppress_type_name true
        # setting sniffer class
        sniffer_class_name Fluent::Plugin::ElasticsearchSimpleSniffer
        # Include tag key
        include_tag_key true
        # Do not use logstash format
        logstash_format false
        # Setting index_name
        index_name fluentd-${index_name}
        # specifying time key
        time_key time
        # including @timestamp field
        include_timestamp true
        # ...
    </match>
</label>
- Setting snifer class (
sniffer_class_name).fluent-plugin-elasticsearchplugin configuration requires to set a specific sniffer class for implementing reconnection logic to ES(sniffer_class_name Fluent::Plugin::ElasticsearchSimpleSniffer). See plugin documentation fluent-plugin-elasticsearh: Sniffer Class Name. - Logging reasons for ElasticSearch API 400 errors (
log_es_400_reason) suppress_type_nameto true to make it work with Elastic 8.0.typedocument has been deprecated in Elastic 8.0- Include
tagkey in the emitted records (include_tag_key true). Tag is part of the records forwarded by Fluent-bit collectors - Do not use logstash format (
logstash_format true). Avoid to generate indexes with the format<logstash_prefix>-YYYY-MM-DD(Rollover will be used) - Add
@timestapfield (include_timestamp) to mimic Logstash behaviour - Set
time_keytotime(original timestamp Fluent-bit extracted from the logs) -
Set index name to
fluentd-hostorfluentd-<namespace>(index_name fluentd-${index_name})index_namekey is generated by filter plugin within@OUTPUT_ESlabel section.# Setup index name. Index per namespace or per container <filter kube.**> @type record_transformer enable_ruby <record> index_name ${record['namespace']} </record> </filter> <filter host.**> @type record_transformer enable_ruby <record> index_name "host" </record> </filter>Note: A different index can be created by pod/container, if different structured logs recores were generated a different index template has to be created to specify the format/syntax of the different fields
In this case index_name can be set to application name
<filter kube.**>
    @type record_transformer
    enable_ruby
    <record>
        index_name ${record['app']}-${record['container']}
    </record>
</filter>
Index Template and ILM policies
fluentd-elasticsearch-plugin supports the creation of index templates and ILM policies associated to each new index it creates in ES.
Index Templates are used for controlling the way ES automatically maps/discover log’s field data types and the way ES indexes these fields.
ES Index Lifecycle Management (ILM) is used for automating the management of indices, and setting data retention policies.
Additionally, separate ES indexes can be created for storing logs from different containers/app. Each index might have its own index template containing specific mapping configuration (schema definition) and its own ILM policy (different retention policies per log type).
Storing logs from different applications in different indexes is an alternative solution to issue #58, avoiding mismatch-data-type ingestion errors that might occur when Merge_Log, option in fluentbit’s kubernetes filter configuration, is enabled.
ILM using fixed index names has been configured. Default plugin behaviour of creating indexes in logstash format (one new index per day) is not used. Dynamic index template configuration is configured, so a separate index is generated for each namespace (index name: fluentd-<namespace>) with a common ILM policy.
-
Configuring ILM policy with rollover support
<label @OUTPUT_ES> <match **> @type elasticsearch # ... # ILM Settings - WITH ROLLOVER support # https://github.com/uken/fluent-plugin-elasticsearch/blob/master/README.Troubleshooting.md#enable-index-lifecycle-management index_date_pattern "" enable_ilm true ilm_policy_id fluentd-policy ilm_policy {"policy":{"phases":{"hot":{"min_age":"0ms","actions":{"rollover":{"max_size":"10gb","max_age":"1d"}}},"delete":{"min_age":"7d","actions":{"delete":{ }}}}}} ilm_policy_overwrite true # ... </match> </label>- Enable ILM (
enable_ilm true), so fluentd can generate ILM policies and attach those policies to the indexes it creates. -
Setting ILM policy id (
ilm_policy_idand content (ilm_policy)ILM policy configured (
ilm_policyfield influent-plugin-elascticsearch) for all fluentd logs is the following:{ "policy": { "phases": { "hot": { "min_age":"0ms", "actions": { "rollover": { "max_size":"10gb", "max_age":"1d" } } }, "delete": { "min_age":"7d", "actions": { "delete": { } } } } } }This policy consists of hot, warm, and delete phases.
-
Hot phase — The index enters into this phase as soon as the index is created (“min_age”: “0ms”). The index moves into the roll-over stage and waits for the conditions to be satisfied: the maximum size is 10 GB (“max_size”: “10gb”) or the age is older than 1 days (“max_age”: “1d”). Once any of these conditions are met, the index is rolled over and transition to delete phase.
-
Delete phase — The index stays in this phase for 7 days (“min_age”: “7d”). Once this time lapses, the index is deleted permanently.
-
- Enable ILM (
-
Dynamic index template
<label @OUTPUT_ES>
    <match **>
        @type elasticsearch
        # ...
        # index template
        use_legacy_template false
        template_overwrite true
        template_name fluentd-${index_name}
        template_file "/etc/fluent/template/fluentd-es-template.json"
        customize_template {"<<shard>>": "1","<<replica>>": "0", "<<TAG>>":"${index_name}"}
        # ...
    </match>
</label>
A index template can be generated per index. These index templates need to be mounted as a volume in Fluentd POD. The index template is a JSON document that can be applied to each index created:
{
  "index_patterns": ["fluentd-<<TAG>>-*"],
  "template": {
    "settings": {
      "index": {
        "lifecycle": {
          "name": "fluentd-policy",
          "rollover_alias": "fluentd-<<TAG>>"
        },
        "number_of_shards": "<<shard>>",
        "number_of_replicas": "<<replica>>"
      }
    },
    "mappings" : {
      "dynamic_templates" : [
          {
            ...
          }
        ]
      }
    }
  }
The template defines the ILM policy to be applied (
fluentd-policy) intemplate.settings.index.lifecycleIt also include the field mappings to be includedtemplate.mappingsfluentd-elasticsearch-plugindynamically replaces<<TAG>>,<<shard>>and<<replica>>parameters with the values stored incustomize_templatefield.customize_template {"<<shard>>": "1","<<replica>>": "0", "<<TAG>>":"${index_app_name}"}
Loki Output Configuration
<label @OUTPUT_LOKI>
    <match **>
        @type loki
        @id out_loki_kube
        @log_level info
        url "#{ENV['LOKI_URL']}"
        username "#{ENV['LOKI_USERNAME'] || use_default}"
        password "#{ENV['LOKI_PASSWORDD'] || use_default}"
        extra_labels {"job": "fluentd"}
        line_format json
        <label>
            app
            container
            pod
            namespace
            host
            filename
        </label>
        # ...
    </match>
</label>
-
urlindicates Loki EndpointIf Loki has been installed following instructions in PiCluster - Loki, the following values need to be provided as environment variables
-
${LOKI_URL}=http://loki-headless.loki:3100 -
Loki endpoint is not protected, so
usernameandpasswordcan be leave as default values. Not need to specify${LOKI_URL}and${LOKI_PASSWORD}
-
-
labelandextra_labesdefine the labels Loki can use to index the logs. Main keys from the record are used to index the logs. -
line_format. Use JSON
Logs from external nodes
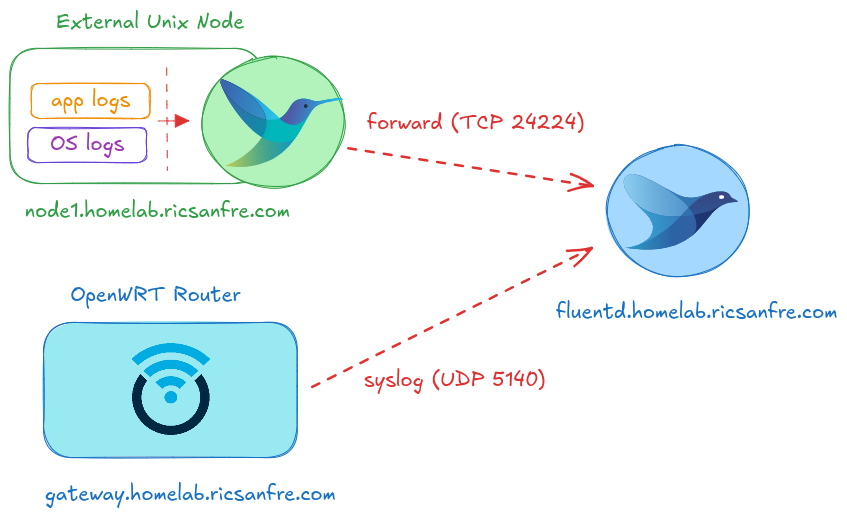
For colleting the logs from external nodes (nodes not belonging to kubernetes cluster: i.e: node1, gateway), fluentd service can be exposed so external systems can use it to ingest logs
Exposing Fluentd Services
Fluentd Forward and Syslog endpoints need to be exposed outside the cluster
In order to expose Fluentd service and be reachable from outside the cluster, a new Kubernetes Service, LoadBalancer type, has to be created:
Note:
Helm chart creates a Service resource (ClusterIP) exposing all ports (forward and metrics ports) to PODS running inside the cluster.
With this Service Resource, only forward and syslog ports will be reachable from outside the cluster.
Apply the following manifest file to the cluster:
apiVersion: v1
kind: Service
metadata:
  labels:
    app: fluentd
  annotations:
    io.cilium/lb-ipam-ips: ${FLUENTD_LOAD_BALANCER_IP}
    external-dns.alpha.kubernetes.io/hostname: fluentd.${CLUSTER_DOMAIN}
  name: fluentd-ext
  namespace: logging
spec:
  ports:
  - name: forward-ext
    port: 24224
    protocol: TCP
    targetPort: 24224
  - name: syslog-ext
    port: 5140
    protocol: UDP
    targetPort: 5140
  selector:
    app.kubernetes.io/name: fluentd
  sessionAffinity: None
  type: LoadBalancer
Note:
Substitute variables (${var}) in the above yaml file before deploying manifest.
- Replace
${FLUENTD_LOAD_BALANCER_IP}by Load balancer IP. IP belonging to Cilium’s Load Balancer address pool range (i.e. 10.0.0.101). - Replace
${CLUSTER_DOMAIN}by the domain name used in the cluster. For example:homelab.ricsanfre.com.
ExternalDNS will automatically create a DNS entry mapped to Load Balancer IP, making fluentd service available at fluentd.{$CLUSTER_DOMAIN} port 24224. Further details in “External DNS - Use External DNS”
Observability
Metrics
Prometheus Integration
In order to monitor Fluentd with Prometheus, fluent-plugin-prometheus plugin need to be installed and configured. The custom docker image fluentd-aggregator, I have developed for this project, has this plugin installed.
To expose Fluentd metrics to Prometheus, the following need to be configure
-
Expose Metrics by Prometheus Input Plugin via HTTP
The following configuration exposes ‘/metrics’ endpoint on port 24231.
# Prometheus metric exposed on 0.0.0.0:24231/metrics <source> @type prometheus @id in_prometheus bind "#{ENV['FLUENTD_PROMETHEUS_BIND'] || '0.0.0.0'}" port "#{ENV['FLUENTD_PROMETHEUS_PORT'] || '24231'}" metrics_path "#{ENV['FLUENTD_PROMETHEUS_PATH'] || '/metrics'}" </source> <source> @type prometheus_monitor @id in_prometheus_monitor </source> <source> @type prometheus_output_monitor @id in_prometheus_output_monitor </source>- It configures
prometheusinput plugin so Prometheus metrics are exposed at/metricson port 24231 - It configures
prometheus_monitorinput plugin so it collects internal fluentd metrics . See metrics details in https://github.com/fluent/fluent-plugin-prometheus?tab=readme-ov-file#prometheus_monitor-input-plugin - It configures
prometheus_output_monitorinput plugin so it collects internal metrics for output plugins. See details about output metrics collected in https://github.com/fluent/fluent-plugin-prometheus?tab=readme-ov-file#prometheus_output_monitor-input-plugin
- It configures
-
Counting Incoming Records by Prometheus Filter Plugin
# Calculate prometheus metrics <filter kube.**> @type prometheus <metric> name fluentd_input_status_num_k8s_records_total type counter desc The total number of incoming records <labels> host $.host app_namespace $.namespace app $.app app_pod $.pod app_container $.container </labels> </metric> </filter> <filter host.**> @type prometheus <metric> name fluentd_input_status_num_host_records_total type counter desc The total number of incoming records <labels> host $.host filename $.filename </labels> </metric> </filter>- It configures
prometheusfilter plugin so records are counted as they arrived - k8s records are counted by container (it labels the counter per
host,namespace,podandcontainerkeys) - host records are counted by filename
- It configures
-
Counting Outgoing Records by Prometheus Output Plugin
# count the number of outgoing records per tag
<match **>
  @type copy
  <store>
      @type relabel
      @label @OUTPUT_ES
  </store>
  <store>
      @type relabel
      @label @OUTPUT_LOKI
  </store>
  <store>
    @type prometheus
    <metric>
      name fluentd_output_status_num_records_total
      type counter
      desc The total number of outgoing records
      <labels>
        host $.host
        filename $.filename
      </labels>
    </metric>
  </store>
</match>
With this configuration output records are counted per record key (
hostandfilename)
Check out further details in Fluentd Documentation: Monitoring by Prometheus.
Integration with Kube-prom-stack
ServiceMonitoring, Prometheus Operator’s CRD, resource can be automatically created so Kube-Prometheus-Stack is able to automatically start collecting metrics from fluentf.
Add following to the helm chart values.yaml file,
# Enable prometheus Service Monitor
metrics:
  serviceMonitor:
    enabled: true
    additionalLabels: {}
  prometheusRule:
    enabled: false
Corresponding Prometheus Operator’s resource, ServiceMonitor will be created, so Kube-Prometheus-Stack can automatically start scraping metrics endpoint.
Grafana Dashboards
If Grafana’s dynamic provisioning of dashboard is configured, Fluentd dashboard (ConfigMap resource) is automatically deployed by Helm chart when providing the following values:
dashboards:
  enabled: "true"
  labels:
    grafana_dashboard: '"1"'