Log Collection (Fluent-bit)
Fluent-bit is deployed in Pi Kubernetes cluster to collect, enrich and distribute logs. It will be configured to process logs from applications running in the Kubernetes cluster, from kubernetes processes (control-plane and workers) and system logs generated by cluster nodes (OS level logs).
What is Fluent-bit?
Fluent-bit is a fast Log, Metrics and Traces Processor and Forwarder. Fluent Bit allows to collect different signal types such as logs, metrics and traces from different sources, process them and deliver them to different backends. Fluent-bit is a CNCF graduated project under fluentd umbrella.
Note: Fluent-bit as generic telemetry agent
In the last releases, Fluent Bit has evolved from a log-focused processing tool to a more general telemetry agent, expanding its capabilities to handle metrics and traces alongside logs, supporting OpenTelemetry standard.
Fluent-bit has been deployed in the cluster using only its logs processing capabilities, but leveraging new Fluent-bit capabilities such as processors
Fluent-bit role in logging architecture
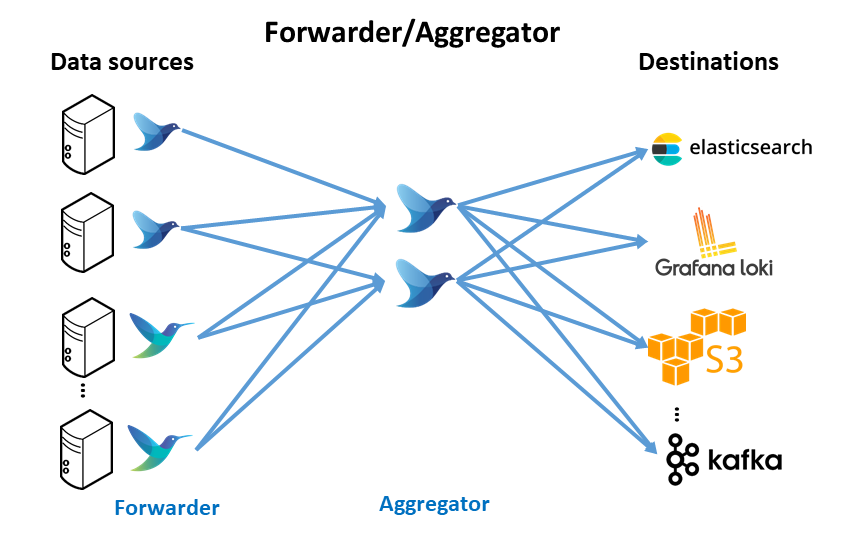
Fluent-bit can be deployed as logging agent instance,forwarder agent, collecting, parsing, filtering, enriching and forwarding logs to any destination (ElasticSearch, Loki, S3) or to log aggregation layer such as Fluentd which aggregates, post-process and route the logs to different destinations.
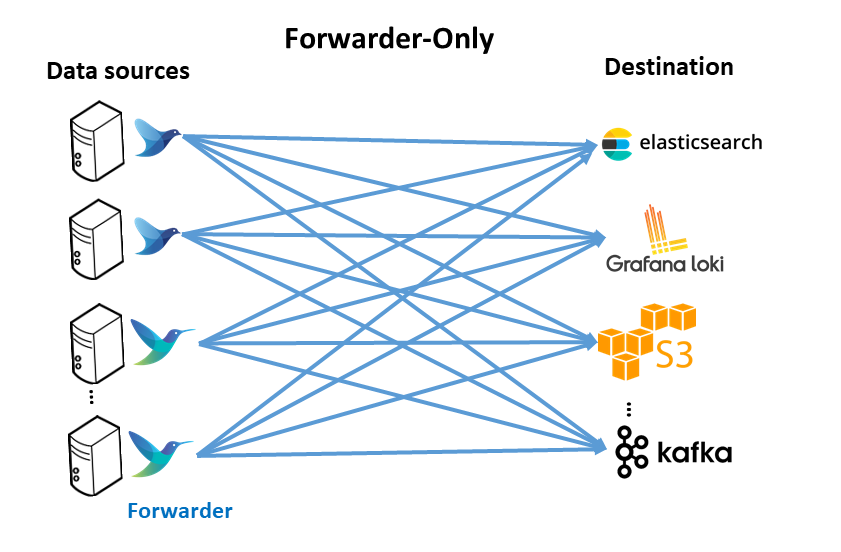
Fluent-bit can work alone if a forwarder-only architecture is deployed or jointly with Fluentd if forwarder/aggregation architecture is selected.
See explanation about different logging architectures approaches in “Pi Cluster - Logging Architectures” and the one selected for the cluster.

Fluent-bit Kubernetes support
Fluent Bit is a lightweight and extensible log processor with full support for Kubernetes clusters:
- Process Kubernetes containers logs from the file system or Systemd/Journald.
- Enrich logs with Kubernetes Metadata.
- Forward enriched logs to destination systems like Elasticsearch, Loki, Kafka, HTTP, etc.
Fluentbit can be installed and configured to collect and parse Kubernetes logs deploying it as a daemonset pod. See fluentbit documentation on how to install it on Kubernetes cluster: “Fluentbit: Kubernetes Production Grade Log Processor”.
How does Fluent-bit work?
Fluent-bit data pipelines
Fluent Bit collects and process logs (also known as records) from different input sources, then parses and filters these records before they’re stored. After data is processed and in a safe state, meaning either in memory or in the file system, the records are routed through the proper output destinations.
graph LR;
  input-->parser
  parser-->filter
  filter-->storage[buffering]
  storage-->router((router))
  router-->output1([output1])
  router-->output2([output2])
  router-->output3([outputN])

  classDef box fill:#326ce5,stroke:#fff,stroke-width:0px,color:#000;
  class input,parser,filter,storage,router,output1,output2,output3 box;
  %%{init: {'themeVariables': { 'lineColor': 'red'}}}%%
Most of the phases in the pipeline are implemented through plugins: input, filter, and output.
-
Input: Fluent Bit provides input plugins to gather information from different sources. Some plugins collect data from log files, while others can gather metrics information from the operating system
-
Parser: Parsers can take any unstructured log entry and give them a structure that makes easier its processing and further filtering. The parser engine is fully configurable and can process log entries based in two types of format:
- JSON Maps
- Regular Expressions (named capture)
By default, Fluent Bit provides a set of pre-configured parsers that can be used for parsing logs from:
- HTTP servers: Apache, Nginx
- Containers: Docker or CRI
- Syslog messages; having parsers supporting rfc5424 and rfc31164
Complete list of available parsers in fluent-bit’s
parsers.confFluent-bit also support multi-line parsers, so logs that span multiple lines, like stack traces of most programming languajes can be correlated. It support built-in multiline-parsers for python, java, go and the capability to support user-defined multiline-parsers.
-
Filter: Filters can perform specific record modifications like appending or removing a key, enriching with metadata (for example, Kubernetes filter), or discarding records based on specific conditions
-
Output: The output define destinations for the processed data
Routing
Fluent-bit routes data through filters and then to one or multiple destinations (output). The routing is based in two concepts:
- Tags
- Matching rules.
When data is generated by an input plugin, it comes with a tag. A Tag is a human-readable indicator that helps to identify the data source. Tags are usually configured manually.
To define where to route data, specify a match rule in the output or filter configuration.
-
Tag Every Event ingested by Fluent Bit is assigned a Tag. This tag is an internal string used in a later stage by the Router to decide which Filter or Output phase it must go through
-
Matching Rule A Match represents a rule to select Events where a
tagmatches a defined rule. Filters and Output plugins contains matching rules
Buffering
When Fluent Bit processes data, it uses the system memory (heap) as a primary and temporary place to store the record logs before they get delivered. The records are processed in this private memory area.
Buffering is the ability to store the records, and continue storing incoming data while previous data is processed and delivered.
It’s possible for logs or data to be ingested or created faster than the ability to flush it to some destinations. A common scenario is when reading from big log files, especially with a large backlog, and dispatching the logs to a backend over the network, which takes time to respond. This generates backpressure, leading to high memory consumption in the service.
Fluent Bit offers a primary buffering mechanism in memory and an optional secondary one using the file system. We will configure this file system bufferng mechanims to increase reliability
When an input plugin source emits records, the engine groups the records together in a chunk. A chunk’s size usually is around 2 MB. By configuration, the engine decides where to place this chunk. By default, all chunks are created only in memory and if filesystem mecahnism is used they are backed to filesystem
-
Memory Buffering
To avoid backpressure, Fluent Bit implements a mechanism in the engine that restricts the amount of data an input plugin can ingest. Restriction is done through the configuration parameters
mem_buf_limitthat limit the number of records in memory.if a plugin has queued more than the
mem_buf_limit, it pauses processing logs till pending logs are flushed to the destination. -
Filesystem buffering
Enabling filesystem buffering in input plugin configuration (
storage.type filesystem) changes the behavior of the engine. Every newly created chunk is active in memory and backed up on disk, and called to beup, which means the chunk content is up in memory.Fluent Bit controls the number of chunks that are
upin memory (storage.max_chunks_upconfiguration). When reaching thestorage.max_chunks_upthreshold, instead of the plugin being paused, all new data will go to chunks that aredownin the filesystem.If
storage.pause_on_chunks_overlimitis enabled (default is off), the input plugin pauses upon exceedingstorage.max_chunks_up.
Collecting cluster logs
Container logs
In Kubernetes, containerized applications that log messages to stdout or stderr streams are captured and redirected to log files in the nodes (/var/log/containers directory). To collect the entries in the log files, filter log events, transform the log data, and ship it off to any log solut backend, a process like, fluentd/fluentbit can be used.
To learn more about kubernetes logging architecture check out “Cluster-level logging architectures” from the official Kubernetes docs. Logging architecture using node-level log agents is the one implemented with fluentbit-based log collectors. Fluentbit proccess run in each node as a kubernetes’ daemonset with enough privileges to access to host’s file system where container logs are stored (/var/logs/containers in K3S implementation).
Fluentbit official helm charts deploy the fluentbit pods as privileged daemonset with access to hots’ /var/logs directory.
In addition to container logs, same Fluentbit agent deployed as daemonset can collect and parse logs from systemd-based services and OS filesystem level logs (syslog, kern.log, etc., all of them located in /var/logs)
K3S container logs
In K3S container logs are stored in /var/logs/containers directory.
Log File Names
Logs from each container are stored in a file whose name follows the format:
<podName>_<namespace_name>_<container_name>-<container_id>
Log lines
Log format used by Kubernetes is different depending on the container runtime used. docker container run-time generates logs in JSON format. containerd run-time, used by K3S, uses CRI log format:
CRI log format is the following:
<time_stamp> <stream_type> <P/F> <log>

where:
  - <time_stamp> has the format `%Y-%m-%dT%H:%M:%S.%L%z` Date and time including UTC offset
  - <stream_type> is `stdout` or `stderr`
  - <P/F> indicates whether the log line is partial (P), in case of multine logs, or full log line (F)
  - <log>: message log
Note:
Fluentbit includes built-in CRI log parser.
Kubernetes logs
In K3S all kubernetes componentes (API server, scheduler, controller, kubelet, kube-proxy, etc.) are running within a single process (k3s). This process when running with systemd writes all its logs to /var/log/syslog file. This file has to be parsed in order to collect logs from Kubernetes (K3S) processes.
K3S logs can be also viewed with journactl command
In master node:
sudo journactl -u k3s
In worker node:
sudo journalctl -u k3s-agent
Host logs
OS level logs (/var/logs) can be collected with the same agent deployed to collect containers logs (daemonset)
Important: About Ubuntu’s syslog-format logs
Some of Ubuntu system logs /var/logs (auth.log, systlog, kern.log) follows a syslog format but with some differences from the systlog standard:
- Priority field is missing
- Timestamp is formatted using system local time.
The syslog format is the following:
<time_stamp> <host> <process>[<PID>] <message>
Where:
  - <time_stamp> has the format `%b %d %H:%M:%S`: local date and time not including timezone UTC offset
  - <host>: hostanme
  - <process> and <PID> identifies the process generating the log
Fluentbit custom parser to be configured so these logs can be parsed.
Installing Fluent-bit
Helm chart Installation
For installing fluent-bit, helm chart from the community will be used. Latest helm chart, as of June 2025, supports fluent configuration using classic syntax (to be deprecated by end of 2025) but not the new YAML syntax. New Fluent-bit features, like Processors or Stream Processors are only available using new YAML syntax.
HelmChart will be configured to provide the fluent-bit YAML file configuration using a external ConfigMap containing instead of using default configMap created containing classic syntax
Fluent-bit will be deployed as DaemonSet and the config file will be externally provided through a ConfigMap
-
Step 1: Create fluent namespace
kubectl create namespace fluent -
Step 2: Create Config Map containing fluent-bit configuration file
apiVersion: v1
kind: ConfigMap
metadata:
  name: fluent-bit-config
  namespace: fluent
data:
  fluent-bit.yaml: |
    service:
       <service_section>
    parsers:
        <parsers_section>
    pipeline:
      inputs:
        <inputs_plugins>
      filters:
        <filter_plugins>
      output:
        <output_plugins>
Note: Previous config file is incomplete, check sections below to get a complete
fluent-bit.yamlconfiguration to be applied to the cluster. -
Step 3: Add fluent helm repo
helm repo add fluent https://fluent.github.io/helm-charts -
Step 4: Update helm repo
helm repo update -
Step 4. Create
values.ymlfor tuning helm chart deployment.# Deploy fluent-bit as daemonSet. One POD per node kind: DaemonSet # Host directories containing Host and POD logs files # Mounted into Fluent-bit DaemonSet POD daemonSetVolumes: # Mount file containing host and POD logs # In K3S, PODS logs are located in /var/log/pods # Host OS logs located in /var/logs - name: varlog hostPath: path: /var/log # Mount /etc/machine-id identifying node - name: etcmachineid hostPath: path: /etc/machine-id type: File daemonSetVolumeMounts: - name: varlog mountPath: /var/log - name: etcmachineid mountPath: /etc/machine-id readOnly: true # Environment variables used by Fluent Config files env: {} # Example environment variables using by Forwarding output plugin # to send logs to a fluentd used as distributor # env: # # Fluentd deployment service # - name: FLUENT_AGGREGATOR_HOST # value: fluentd # # Default fluentd forward port # - name: FLUENT_AGGREGATOR_PORT # value: "24224" # - name: FLUENT_AGGREGATOR_SHARED_KEY # valueFrom: # secretKeyRef: # name: fluent-bit-env-secret # key: FLUENT_AGGREGATOR_SHARED_KEY # Environment variables used by Fluent Config files # also can be loaded from a ConfigMap or Secret # envFrom: # - configMapRef: # name: fluent-bit-env-configmap # - secretRef: # name: fluent-bit-env-secret # Define configuration file in external configMap using YAML syntax # Remove classic default configuration config: {} customParsers: {} # Instead of using pre-defined configMap created by Helm Chart, use a existing configMap # ConfigMap mounted as /fluent-bit/etc/conf directory existingConfigMap: fluent-bit-config # Change args to load yaml config file instead default fluent-bit.conf command: - /fluent-bit/bin/fluent-bit args: - --workdir=/fluent-bit/etc - --config=/fluent-bit/etc/conf/fluent-bit.yaml # Lua Scripts. ConfigMap luascripts mounted as /fluent-bit/scripts luaScripts: {} # Example lua Script for changing local time to UTC # luaScripts: # adjust_ts.lua: | # function local_timestamp_to_UTC(tag, timestamp, record) # local utcdate = os.date("!*t", ts) # local localdate = os.date("*t", ts) # localdate.isdst = false -- this is the trick # utc_time_diff = os.difftime(os.time(localdate), os.time(utcdate)) # return 1, timestamp - utc_time_diff, record # end # Enable fluentbit installation on control-plane nodes tolerations: - key: node-role.kubernetes.io/control-plane operator: Exists effect: NoSchedule # Init container. Create directory for fluentbit initContainers: - name: init-fluentbit-directory image: busybox command: ['/bin/sh', '-c', 'if [ ! -d /var/log/fluentbit ]; then mkdir -p /var/log/fluentbit; fi ; if [ ! -d /var/log/fluentbit/tail-db ]; then mkdir -p /var/log/fluentbit/tail-db; fi ; if [ ! -d /var/log/fluentbit/storage ]; then mkdir -p /var/log/fluentbit/storage; fi'] volumeMounts: - name: varlog mountPath: /var/log # Enable hot-reload # jimmidyson/configmap-reload is deployed as side-car # By default it watches for changes in /fluent-bit/etc/conf/ (fluent-conf) and /fluent-bit/scripts (luascripts) # If any change is detected reload endpoint is ivoked: # http://localhost:2020/api/v2/reload hotReload: enabled: true # Enable Prometheus operator service monitor serviceMonitor: enabled: true # Enable Grafana dashboard dashboards: enabled: true labelKey: grafana_dashboard labelValue: 1 annotations: grafana_folder: "Logging"fluentbit configuration can be provided to the helm. See
values.yml -
Step 4. Install chart into fluent namespace
helm install fluent-bit fluent/fluent-bit -f values.yml --namespace fluent -
Step 5: Check fluent-bit status
kubectl get all -l app.kubernetes.io/name=fluent-bit -n fluent
Helm chart configuration Details
Fluent-bit deployed as DaemonSet and using YAML config file
# Deploy fluent-bit as daemonSet. One POD per node
kind: DaemonSet
# Host directories containing Host and POD logs files
# Mounted into Fluent-bit DaemonSet POD
daemonSetVolumes:
  # Mount file containing host and POD logs
  # In K3S, PODS logs are located in /var/log/pods
  # Host OS logs located in /var/logs
  - name: varlog
    hostPath:
      path: /var/log
  # Mount /etc/machine-id identifying node
  - name: etcmachineid
    hostPath:
      path: /etc/machine-id
      type: File
daemonSetVolumeMounts:
  - name: varlog
    mountPath: /var/log
  - name: etcmachineid
    mountPath: /etc/machine-id
    readOnly: true

# Define configuration file in external configMap using YAML syntax
# Remove classic default configuration
config: {}
customParsers: {}
# Instead of using pre-defined configMap created by Helm Chart, use a existing configMap
# ConfigMap mounted as /fluent-bit/etc/conf directory
existingConfigMap: fluent-bit-config

# Lua Scripts. ConfigMap luascripts mounted as volume /fluent-bit/scripts
luaScripts: {}

# Change args to load yaml config file instead default fluent-bit.conf
command:
  - /fluent-bit/bin/fluent-bit

args:
  - --workdir=/fluent-bit/etc
  - --config=/fluent-bit/etc/conf/fluent-bit.yaml
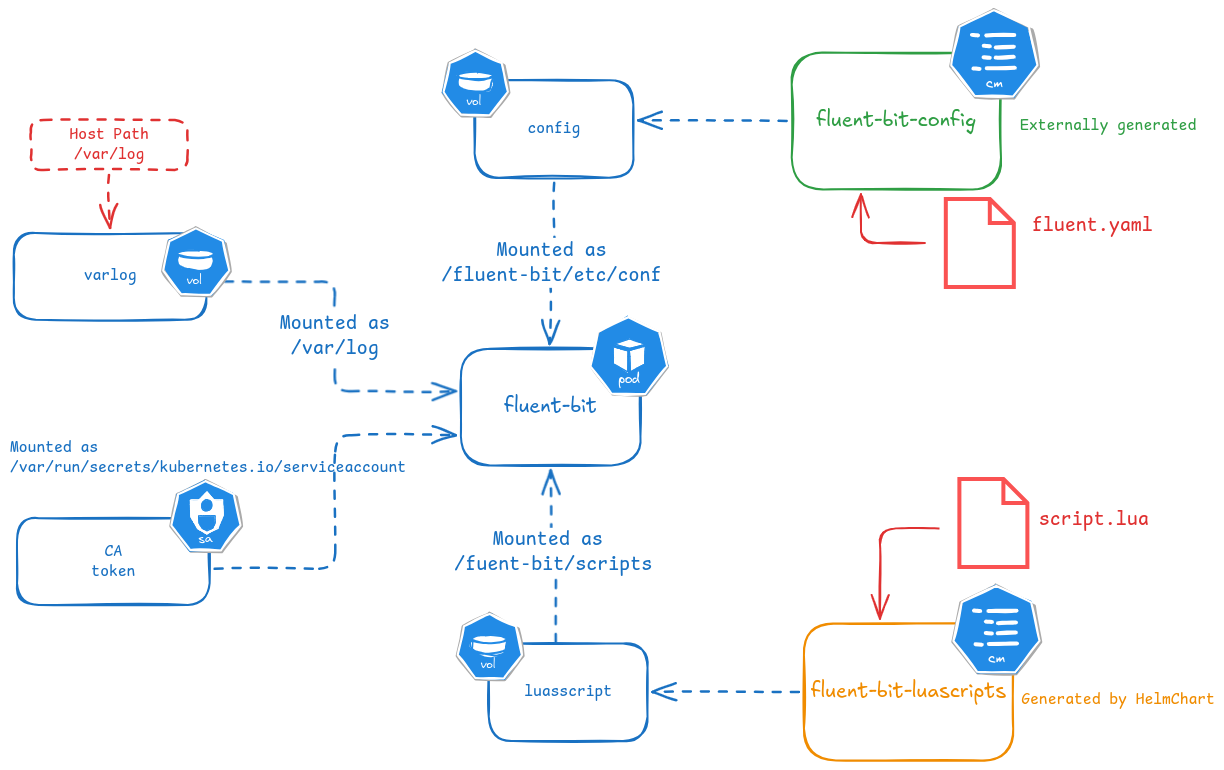
- Fluent-bit is deployed as privileged daemonSet:
kind - Every fluent-bit POD mounts the following volumes
- configMap volume. Containing fluent-bit configuration files and the lua scripts that can be used during the parsing.
fluent-bit-configConfigMap, using existing ConfigMap instead of the pre-defined by HelmChart, containing Fluent-bit config files in YAML mounted as/fluent-bit/etc/conffluent-luascriptConfigMap (created automatically by the helmChart from the files defined using helm chartluaScripts)
- hostPath volume. Host Path
/var/logs, containing POD and host logs, is mounted as/var/logsin the POD:daemonSetVolumesanddaemonSetVolumesMount
- configMap volume. Containing fluent-bit configuration files and the lua scripts that can be used during the parsing.
- Fluent-bit command line is updated to use YAML config file instead default (Update
argsHelmchart value to change--configcommand line parameter)
Enabling fluent-bit deployment in master node
Fluentbit pod tolerations can be configured through helm chart value tolerations, so fluent-bit POD can be deployed also in master nodes.
  tolerations:
    - key: node-role.kubernetes.io/control-plane
      operator: Exists
      effect: NoSchedule
Init container for creating fluentbit DB temporary directory
Pod init-container used for creating /var/log/fluentbit directory in each node.
- To store Fluent-bit
tailplugin database keeping track of monitored files and offsets (tailinput plugin,dbparameter):/var/log/fluentbit/tail-db - To store Fuent-bit file-system buffering:
/var/log/fluentbit/storage(servicestorageconfiguration)
initContainers:
  - name: init-fluentbit-directory
    image: busybox
    command: ['/bin/sh', '-c', 'if [ ! -d /var/log/fluentbit ]; then mkdir -p /var/log/fluentbit; fi ; if [ ! -d /var/log/fluentbit/tail-db ]; then mkdir -p /var/log/fluentbit/tail-db; fi ; if [ ! -d /var/log/fluentbit/storage ]; then mkdir -p /var/log/fluentbit/storage; fi']
    volumeMounts:
      - name: varlog
        mountPath: /var/log
initContainer is based on busybox image that creates a directory /var/logs/fluentbit
Hot-reload sidecar
configmap-reload can be deployed as a POD sidecar.
By default, helm chart configures it to watch for changes in /fluent-bit/etc/conf/ (fluent-conf) and /fluent-bit/scripts (luascripts). If it detects any change, fluent-bit reload endpoint (http://localhost:2020/api/v2/reload) is invoked.
# Enable hot-reload
# jimmidyson/configmap-reload is deployed as side-car
# By default it watches for changes in /fluent-bit/etc/conf/ (fluent-conf) and /fluent-bit/scripts (luascripts)
# If any change is detected reload endpoint is ivoked:
# http://localhost:2020/api/v2/reload
hotReload:
  enabled: true
With this configuration if configMap containing fluent.yaml file, fluent-bit is automatically reloaded
Fluent-bit container environment variables.
Fluent-bit environmnet variables can be used in fluent-bit configuration file (fluent-bit.yaml) using the ${VARIABLE_NAME} syntax.
Any environment variable used by Fluent-bit configuration can be provided to Fluent-bit pod through env and envFrom helm chart value.
# Environment variables used by Fluent Config files
env: {}
# Example environment variables using by Forwarding output plugin
# to send logs to a fluentd used as distributor
# env:
#   # Fluentd deployment service
#   - name: FLUENT_AGGREGATOR_HOST
#     value: fluentd

#   # Default fluentd forward port
#   - name: FLUENT_AGGREGATOR_PORT
#     value: "24224"
#   - name: FLUENT_AGGREGATOR_SHARED_KEY
#     valueFrom:
#       secretKeyRef:
#         name: fluent-bit-env-secret
#         key: FLUENT_AGGREGATOR_SHARED_KEY

# Environment variables used by Fluent Config files
# also can be loaded from a ConfigMap or Secret
# envFrom:
#   - configMapRef:
#       name: fluent-bit-env-configmap
#   - secretRef:
#       name: fluent-bit-env-secret
Configuring Fluent-bit
Differente Fluent-bit data-pipelines will be configured to collect and process logs and route them to different destinations depending on the logging architecture selected for the cluster.
Forwarder/Aggregator architecture
Fluent-bit collecting, processing the logs and forwarding them to Fluentd
Data pipeline to be configured in this case is the following:
graph LR;
  tail1[**tail**
/var/log/containers/*]-->parser1
  tail2[**tail**
/var/log/syslog]-->parser2
  parser1[**cri parser**]--tag: kube -->filter1
  parser2[**syslog parser**]--tag: host-->filter1
  filter1[**multiline**]-- tag: kube -->filter2
  filter2[**kubernetes**]-->filter3
  filter3[**lua filter**]-->filter4
  filter4[**nest**]--> filter5
  filter5[**modify**]--> output1
  filter1-- tag: host --> output1
  subgraph input
    tail1
    tail2
    parser1
    parser2
  end
  subgraph filters
    filter1
    filter2
    filter3
    filter4
    filter5
  end
  subgraph output
    output1
  end
  output1[forward]--> fluentd(fluentd)
  linkStyle default stroke:#e59d32,stroke-width:2px,color:#000
  classDef box fill:#326ce5,stroke:none,stroke-width:0px,color:#000;
  classDef out fill:#ddd,stroke:green,stroke-width:4px,color:green;
  classDef group fill:none,stroke:#e53232,stroke-width:2px,color:#e53232;
  class tail1,tail2,parser1,parser2,filter1,filter2,filter3,filter4,filter5,output1 box;
  class fluentd out;
  class input,filters,output group;
The complete YAML configuration file is the following:
# Service configuration
service:
  daemon: false
  flush: 1
  # Log Level
  log_level: info
  # Enable HTTP Server
  http_server: true
  http_listen: 0.0.0.0
  http_port: 2020
  # Enable Health Check
  health_check: true
  # Enable Hot Reload
  hot_reload: true
  # Enabling filesystem buffering
  storage.path: /var/log/fluentbit/storage
  storage.sync: full
  storage.checksum: true
  storage.backlog.mem_limit: 5M
  storage.metrics: true
parsers:
    # Ubuntu syslog parser
  - name: syslog-rfc3164-nopri
    format: regex
    regex: '/^(?<time>[^ ]* {1,2}[^ ]* [^ ]*) (?<host>[^ ]*) (?<ident>[a-zA-Z0-9_\/\.\-]*)(?:\[(?<pid>[0-9]+)\])?(?:[^\:]*\:)? *(?<log>.*)$/'
    time_key: time
    time_format: '%b %d %H:%M:%S'
    time_keep: false
pipeline:
  inputs:
      # kubernetes logs
    - name: tail
      alias: input.kube
      path: /var/log/containers/*.log
      # Add filename key to the record
      path_key: filename
      # Enable buil-in multi-line cri parser
      multiline.parser: cri
      # Set kube. prefix in the predefined tag (filepath)
      tag: kube.*
      # Enable tail state feature
      db: /var/log/fluentbit/flb_kube.db
      storage.type: filesystem
      skip_long_lines: true
      # K3s and OS level logs
    - name: tail
      alias: input.host
      path: /var/log/auth.log, /var/log/syslog
      path_key: filename
      parser: syslog-rfc3164-nopri
      tag: host.*
      db: /var/log/fluentbit/flb_host.db
      storage.type: filesystem
  filters:
    - name: multiline
      match: '*'
      multiline.key_content: log
      multiline.parser: go, java, python
    - name: kubernetes
      match: kube.*
      buffer_size: 512k
      kube_tag_prefix: kube.var.log.containers.
      merge_log: false
      k8s-logging.parser: true
      k8s-logging.exclude: true
      labels: true
      annotations: false
    - name: lua
      match: kube.*
      script: /fluent-bit/scripts/parse_kubernetes_metadata.lua
      call: extract_app_name
    - name: nest
      match: kube.*
      operation: lift
      nested_under: kubernetes
      add_prefix: kubernetes_
    - name: modify
      match: kube.*
      rename: kubernetes_pod_name pod
      rename: kubernetes_namespace_name namespace
      rename: kubernetes_container_name container
      rename: kubernetes_host host
      remove_wildcard: kubernetes_
      remove: _p

  outputs:
    - name: forward
      alias: output.aggregator
      match: '*'
      host: ${FLUENT_AGGREGATOR_HOST}
      port: ${FLUENT_AGGREGATOR_PORT}
      self_hostname: ${FLUENT_SELFHOSTNAME}
      shared_key: ${FLUENT_AGGREGATOR_SHARED_KEY}
      tls: true
      tls.verify: false
The environemnt variables that need to be set are only needed to configure Forward Output Plugin:
${FLUENT_AGGREGATOR_HOST}${FLUENT_AGGREGATOR_PORT}
See configuration details in sections below.
Find details about installing Fluentd as log aggregation layer in “Pi Project - Log Aggregation and Distribution with Fluentd
Forwarder Only-Configuration
Fluent-bit collecting, processing and routing logs directly to different destinations
Data pipeline to be configured in this case is the following:
graph LR;
  tail1[**tail**
/var/log/containers/*]-->parser1
  tail2[**tail**
/var/log/syslog]-->parser2
  parser1[**cri parser**]--tag: kube -->filter1
  parser2[**syslog parser**]--tag: host-->filter1
  filter1[**multiline**]-- tag: kube -->filter2
  filter2[**kubernetes**]-->filter3
  filter3[**lua filter**]-->filter4
  filter4[**nest**]--> filter5
  filter5[**modify**]--> output1
  filter5--> output2
  filter1-- tag: host --> output1
  filter1-- tag: host --> output2
  output1[loki]--> loki[(loki)]
  output2[elasticsearch] --> elasticsearch[(elasticsearch)]
  subgraph input
    tail1
    tail2
    parser1
    parser2
  end
  subgraph filters
    filter1
    filter2
    filter3
    filter4
    filter5
  end
  subgraph output
    output1
    output2
  end
  linkStyle default stroke:#e59d32,stroke-width:2px,color:#000
  classDef box fill:#326ce5,stroke:none,stroke-width:0px,color:#000;
  classDef out fill:#ddd,stroke:green,stroke-width:4px,color:green;
  classDef group fill:none,stroke:#e53232,stroke-width:2px,color:#e53232;
  class tail1,tail2,parser1,parser2,filter1,filter2,filter3,filter4,filter5,output1,output2 box;
  class loki,elasticsearch out;
  class input,filters,output group;
The complete YAML configuration file is the following:
# Service configuration
service:
  daemon: false
  flush: 1
  # Log Level
  log_level: info
  # Enable HTTP Server
  http_server: true
  http_listen: 0.0.0.0
  http_port: 2020
  # Enable Health Check
  health_check: true
  # Enable Hot Reload
  hot_reload: true
  # Enabling filesystem buffering
  storage.path: /var/log/fluentbit/storage
  storage.sync: full
  storage.checksum: true
  storage.backlog.mem_limit: 5M
  storage.metrics: true
parsers:
    # Ubuntu syslog parser
  - name: syslog-rfc3164-nopri
    format: regex
    regex: '/^(?<time>[^ ]* {1,2}[^ ]* [^ ]*) (?<host>[^ ]*) (?<ident>[a-zA-Z0-9_\/\.\-]*)(?:\[(?<pid>[0-9]+)\])?(?:[^\:]*\:)? *(?<log>.*)$/'
    time_key: time
    time_format: '%b %d %H:%M:%S'
    time_keep: false
pipeline:
  inputs:
      # kubernetes logs
    - name: tail
      alias: input.kube
      path: /var/log/containers/*.log
      # Add filename key to the record
      path_key: filename
      # Enable buil-in multi-line cri parser
      multiline.parser: cri
      # Set kube. prefix in the predefined tag (filepath)
      tag: kube.*
      # Enable tail state feature
      db: /var/log/fluentbit/flb_kube.db
      storage.type: filesystem
      skip_long_lines: true
      # K3s and OS level logs
    - name: tail
      alias: input.host
      path: /var/log/auth.log, /var/log/syslog
      path_key: filename
      parser: syslog-rfc3164-nopri
      tag: host.*
      db: /var/log/fluentbit/flb_host.db
      storage.type: filesystem
  filters:
    - name: multiline
      match: '*'
      multiline.key_content: log
      multiline.parser: go, java, python
    - name: kubernetes
      match: kube.*
      buffer_size: 512k
      kube_tag_prefix: kube.var.log.containers.
      merge_log: false
      k8s-logging.parser: true
      k8s-logging.exclude: true
      labels: true
      annotations: false
    - name: lua
      match: kube.*
      script: /fluent-bit/scripts/parse_kubernetes_metadata.lua
      call: extract_app_name
    - name: nest
      match: kube.*
      operation: lift
      nested_under: kubernetes
      add_prefix: kubernetes_
    - name: modify
      match: kube.*
      rename: kubernetes_pod_name pod
      rename: kubernetes_namespace_name namespace
      rename: kubernetes_container_name container
      rename: kubernetes_host host
      remove_wildcard: kubernetes_
      remove: _p

  outputs:
    - name: es
      alias: output.es
      match: '*'
      host: ${FLUENT_ELASTICSEARCH_HOST}
      port: ${FLUENT_ELASTICSEARCH_PORT}
      http_user: ${FLUENT_ELASTICSEARCH_USER}
      http_passwd: ${FLUENT_ELASTICSEARCH_PASSWORD}
      # Indexes are created following logstash format <logstash_prefix>-<YYYY-mm-dd>
      logstash_format: true
      logstash_prefix: fluentbit
      # Mandatory for ES 8.x
      suppress_type_name: true
      # Disable TLS
      tls: false
      # Disable limit in retries
      retry_limit: false
    - name: loki
      alias: output.loki
      match: '*'
      host: ${FLUENT_LOKI_HOST}
      port: ${FLUENT_LOKI_PORT}
      labels: job=fluentbit
      label_keys: $app, $container, $pod, $namespace, $host, $filename
      line_format: json
      # Disable TLS
      tls: false
        # Disable limit in retries
      retry_limit: false
Differences with previous configuration are only the set of Output-Plugins configured
The environemnt variables that need to be set are related to ElasticSearch and Loki Output Plugins:
${FLUENT_ELASTICSEARCH_HOST}${FLUENT_ELASTICSEARCH_PORT}${FLUENT_ELASTICSEARCH_USER}${FLUENT_ELASTICSEARCH_PASSWORD}${FLUENT_LOKI_HOST}${FLUENT_LOKI_PORT}
See configuration details in sections below.
Global Service Configuration
Enable HTTP Server
Fluent-bit HTTP server can be enabled so different endpoints are exposed for getting information, metrics and remotely operate fluent-bit
The following configuration instructs Fluent Bit to start an HTTP server on TCP port 2020 and listen on all network interfaces:
service:
  http_server: true
  http_listen: 0.0.0.0
  http_port: 2020
Some of the endpoints exposed are:
| URI | Description | Data format |
|---|---|---|
/ |
Fluent Bit build information. | JSON |
/api/v1/uptime |
Return uptime information in seconds. | JSON |
/api/v1/health |
Display the Fluent Bit health check result. health_check need to be enabled within SERVICE section |
String |
/api/v2/metrics/prometheus |
Display internal metrics per loaded plugin ready in Prometheus Server format. | Prometheus Compliant metrics |
/api/v2/reload |
Execute hot reloading or get the status of hot reloading. See the hot-reloading documentation. | JSON |
Enable Health Check
Fluent-bit health check feature calculate fluent-bit health based on the number of errors and retry failure errors across all output plugins.
By default this feature is disabled (health_check = false)
The following options need to be added to enable health check calculation and /api/v1/health endpoint.
service:
  # Enable HTTP Server
  # ...
  # Enable Health Check
  health_check: true
  hc_peridod: 60
  hc_error_count: 5
  hc_retry_failure_count: 5
Based on the hc_period setting, if the real error number is over hc_errors_count, or retry failure is over hc_retry_failure_Count, Fluent Bit is considered unhealthy. The health endpoint returns an HTTP status 500 and an error message. Otherwise, the endpoint returns HTTP status 200 and an ok message.
Further details in Fluent-bit Monitoring -HealthCheck
Hot Reloading
Fluent Bit supports the reloading feature when enabled in the configuration file (or on the command line with -Y or --enable-hot-reload)
service:
  # Enable HTTP Server
  # ...
  # Enable Hot Reload
  hot_reload: on
After updating the configuration file, fluent-bit can be reloaded sending a empty POST request to hot-reload endpoint /api/v2/reload
curl -X POST -d '{}' localhost:2020/api/v2/reload
Enabling Filesystem buffering
The following configuration need to be added to service section
service:
  # ...
  # Enabling filesystem buffering
  storage.path: /var/log/fluentbit/storage
  storage.sync: full
  storage.checksum: true
  storage.backlog.mem_limit: 5M
  storage.max_chunks_up: 128
  storage.backlog.flush_on_shutdown: true
  storage.metrics: true
It configures filesystem buffering:
storage.path: Location in the file system to store streams and chunks of data.storage.sync:fullincreases the reliability of the filesystem buffer and ensures that data is guaranteed to be synced to the filesystem even if Fluent Bit crashes.storage.checksumto true. Enable the data integrity check when writing and reading data from the filesystem.storage.max_chunks_up: to control the number of chunks in memorystorage.backlog.mem_limit: to control the ammount of memory that can be used to load automatically backlog chunks (chunks of data not delivered in filesystem) after a restartstorage.metrics: Enable exposure of storage metrics endpoint Fluent Bit will attempt to flush all backlog filesystem chunks to their destination(s) during the shutdown process.
Additional configuration must be provided within each input plugins configuration to enable flilesystem buffering
pipelines:
  inputs:
    - name: <plugin_name>
      storage.type: filesystem
Inputs
Container logs parsing
pipeline:
  inputs:
      # kubernetes logs
    - name: tail
      alias: input.kube
      path: /var/log/containers/*.log
      path_key: filename
      multiline.parser: cri
      tag: kube.*
      db: /var/log/fluentbit/flb_kube.db
      storage.type: filesystem
      skip_long_lines: true
It configures fluentbit to monitor kubernetes containers logs, using tail input plugin with the following options:
-
alias: plugin alias is configured to provide more readable metrics. See fluentbit monitoring documentation. -
path: tail plugin read all files whose name matches the regular expression/var/log/container/*.log, which are all logs generated by the different containers of the different PODs -
path_key:filenamekey is added to all the records containing file path -
tag: all logs are tagged adding prefixkube.. Note thattagfield includes asterisk (*) character. It makes fluent-bit to replace that asterisk will be replaced with the absolute path of the monitored file, with slashes replaced by dots. So all events will be tagged askube.var.log.container.file_name.logAbout tag expansion
Tail supports tags expansion. If a tag has a star character (*), it will replace the value with the absolute path of the monitored file, so if your filename and path is:
/var/log/container/<pod_name>_<namespace_name>_<container_name>-<container_id>.logThen the tag for every record of that file becomes:
kube.var.log.containers.<pod_name>_<namespace_name>_<container_name>-<container_id>.logSlashes (/) are replaced with dots (.).See further details in Fluent-bit docs: Workflow of Tail and Kubernetes filter
-
cri
multiline.parser: is configured enabling the parsing of multi-line logs generated bycontainerd.Fluent-bit’s built-in
crimultiline parser is used. See further details in Fluent-bit: Tail - Multiline support.Multiline parser engine provides built-in multiline parsers (supporting docker and cri logs formats) and a way to define custom parsers.
For
containerdlogs multiline parsercriis needed. Embedded implementation of this parser applies the following regexp to the input lines:"^(?<time>.+) (?<stream>stdout|stderr) (?<_p>F|P) (?<log>.*)$"Fourth field (“F/P”) indicates whether the log is full (one line) or partial (more lines are expected). See more details in this fluentbit feature request.
Fields extracted from cri logs are:
time,stream,_pandlog. Partila logs Logs containing partialSee implementation in code: flb_ml_parser_cri.c.
-
skip_long_lines. When a monitored file reaches its buffer capacity due to a very long line (`buffer_max_size), the default behavior is to stop monitoring that file. skip_long_lines set to true alter that behavior and instruct Fluent Bit to skip long lines and continue processing other lines that fits into the buffer size. -
db: to enable tail plugin feature to save the state of the tracked files. If the database parameter DB is not specified, by default the plugin reads each target file from the beginning. To avoid this behaviour which generates log duplicates across fluent-bit restarts, this feature must be configured.Fluent Bit keep the state or checkpoint of each file through using a SQLite database file, so if the service is restarted, it can continue consuming files from it last checkpoint position (offset)
When running, the database file /path/to/logs.db will be created, this database is backed by
SQLite3so if you are interested into explore the content, you can open It can be opened using SQLite client tool, e.g:$ sqlite3 tail.db -- Loading resources from /home/edsiper/.sqliterc SQLite version 3.14.1 2016-08-11 18:53:32 Enter ".help" for usage hints. sqlite> SELECT * FROM in_tail_files; id name offset inode created ----- -------------------------------- ------------ ------------ ---------- 1 /var/log/syslog 73453145 23462108 1480371857 sqlite>The SQLite journaling mode enabled is Write Ahead Log or WAL. This allows to improve performance of read and write operations to disk. When enabled int the path specified.
This option will create the following SQLite files:
/var/log/fluentbit/flb_kube.db/var/log/fluentbit/flb_kube.db-shm/var/log/fluentbit/flb_kube.db-wal
To keep track of the latest log processed between fluent-bit daemon restarts, those files will be stored in host-path volume (
/var/log/fluentbit).Note:
/var/log/fluentbitpath need to be created in every node of the cluster. init-container configured when deploying helm chart, creates this directory if it does not exists.See furhter details in Fluentbit tail input: keeping state”.
-
storage.type. Enabling filesystem buffering mechanism
records generated have the following fields:
| field name | Description |
|---|---|
time |
log timestamp. Extracted from cri log format |
stream |
containing values stdout or stderr. Extracted from cri log format |
_p |
Field indicating full (F) or partial (P) log. Extracted form cri log format. |
log |
Field containing log message. Extracted form cri log format |
filename |
File path . Field added by tail plugin |
OS level system logs
parsers:
    # Ubuntu syslog parser
  - name: syslog-rfc3164-nopri
    format: regex
    regex: '/^(?<time>[^ ]* {1,2}[^ ]* [^ ]*) (?<host>[^ ]*) (?<ident>[a-zA-Z0-9_\/\.\-]*)(?:\[(?<pid>[0-9]+)\])?(?:[^\:]*\:)? *(?<log>.*)$/'
    time_key: time
    time_format: '%b %d %H:%M:%S'
    time_keep: false
pipeline:
  inputs:
      # K3s and OS level logs
    - name: tail
      alias: input.host
      path: /var/log/auth.log, /var/log/syslog
      path_key: filename
      parser: syslog-rfc3164-nopri
      tag: host.*
      db: /var/log/fluentbit/flb_host.db
      storage.type: filesystem
It configures fluentbit to monitor OS logs, using tail input plugin with the following options:
-
alias: plugin alias is configured to provide more readable metrics. See fluentbit monitoring documentation. -
path: tail plugin read only/var/log/auth.logand/var/log/syslogfiles -
path_key:filenamekey is added to all the records containing file path -
parser: custom parser is used to parse Ubuntu’s non-compliance syslog messages (syslog withoutpriority).syslog-rfc3164-nopriparser is defined inparserssection. -
tag: all logs are tagged adding prefixkube.. Note thattagfield includes asterisk (*) character. It makes fluent-bit to replace that asterisk will be replaced with the absolute path of the monitored file (tag expansion), with slashes replaced by dots. So all events will be tagged ashost.var.log.file_name.log -
dbparameter is also specified to keep track of the logs already processed. -
storage.typeconfigured to enable filesystem buffering.
Filters
Multi-line filter
This filter activates fluentbit built-in mutiline parsers/filters (availible since v1.8.2) to concatenate stack trace log messages (multiline logs). Built-in multine parsers, included in the above filter definition, are able to detect stack traces generated by java, python and go languages. Customized multiline-parsers can be also defined as part of the configuration (multiline_parsers section in fluent-bit.yaml )
pipelines:
...
  filters:
    - name: multiline
      match: '*'
      multiline.key_content: log
      multiline.parser: go, java, python
match: Filter applies to all logs (tag =*).multiline.key_content: It applies logic tologfield containing log message generatd by the applicationmultiline.parser: It uses buil-in multiline parses for go, python and java.
See furthter details multiline filter doc.
Note:
Multiline parser built-in capability is already configured for Tail input (using cri parsers) to parse possible multiline containerd logs. In this case this multiline filter is needed to apply mutiline filter to the log field, field extracted applyinc CRI parser while parsing containerd log (original log app)
Kubernetes filter
Fluent Bit Kubernetes filter enriches log files with Kubernetes metadata.
This filter can perform the following operations:
- Analyze the Tag and extract the following metadata:
- Pod Name
- Namespace
- Container Name
- Container ID
- Query Kubernetes API Server or Kubelet to obtain extra metadata for the pod in question:
- Pod ID
- Labels
- Owner References
- Annotations
- Namespace Labels
- Namespace Annotations
The data is cached locally in memory and appended to each record.
pipelines:
  filters:
    # ...
    - name: kubernetes
      match: kube.*
      buffer_size: 512k
      kube_tag_prefix: kube.var.log.containers.
      # Do not proccess `log` field
      merge_log: false
      # Enable POD annotations
      k8s-logging.parser: true
      k8s-logging.exclude: true
      # Include in the enrichment POD labels
      labels: true
      # Do not include in the enrichment POD annotations
      annotations: true
Extracting Data from Tag
From tail input plugin kuberntes records are tagged as kube.var.log.containers.<filename>.log
If the configuration property kube_tag_prefix was configured, it will use that value to remove the prefix that was appended to the Tag in the previous Input section. The configuration property defaults to kube.var.logs.containers. , so the previous tag content will be transformed from:
kube.var.log.containers.apache-logs-annotated_default_apache-aeeccc7a9f00f6e4e066aeff0434cf80621215071f1b20a51e8340aa7c35eac6.log
to:
apache-logs-annotated_default_apache-aeeccc7a9f00f6e4e066aeff0434cf80621215071f1b20a51e8340aa7c35eac6.log
Rather than modify the original tag, the transformation creates a new representation for the filter to perform metadata lookup.
The new value is used by the filter to lookup the pod name and namespace, for that purpose it uses an internal regular expression:
(?<pod_name>[a-z0-9](?:[-a-z0-9]*[a-z0-9])?(?:\.[a-z0-9]([-a-z0-9]*[a-z0-9])?)*)_(?<namespace_name>[^_]+)_(?<container_name>.+)-(?<docker_id>[a-z0-9]{64})\.log$
See regex used to extract information from tag in kubernetes filter code
Extracting labels/annotations from Kube API
Through filter boolean keys labels (POD labels), annotations (POD annotations), namespace_labels (namespace labesl), namespace_annotations (namespace annotations) and owner_references (owner references), the amount of metadata retrieved from Kubernetes API can be limited.
By default, Kube API is only used to get POD Id.
kube_url, kube_ca_file and kube_token_file need to be provided to grant fluent-bit POD access to Kubernetes API. Default value of those keys are enough to make Fluent-bit work in Kubernetes when using Fluent-bit Helm Chart. Helm chart generates the corresponding Kubernetes ServiceAccount and ClusterRole and ClusterRoleBinding resources with enough privileges.
Daemonset deployment generates
All kubernetes metadata is stored within the processed log as a kubernetes map.
Important: About Buffer_Size when connecting to Kuberenetes API
Kubernetes filter’s buffer_size default value is set to 32K which it is not enough for getting all metadata of some of the PODs. With default value, Kubernetes filter was not able to get metadata information for some of the PODs (i.e.: elasticsearh). Increasing its value to 512k makes it work.
Output sample record from this filter in json format
{
    "date":1750248166.869028,
    "time":"2025-06-18T12:02:46.869027667Z",
    "stream":"stdout",
    "_p":"F",
    "log":"[WARNING] No files matching import glob pattern: /etc/coredns/custom/*.override",
    "filename":"/var/log/containers/coredns-ccb96694c-xhjtm_kube-system_coredns-2b47cfafc44227527ebd36f71998e290e2db38db29bff4a3c7355d578fdf16f2.log",
    "kubernetes":{
        "pod_name":"coredns-ccb96694c-xhjtm",
        "namespace_name":"kube-system",
        "pod_id":"1395c788-6f97-405b-b90b-e0db1deb3beb",
        "labels":{
            "k8s-app":"kube-dns",
            "pod-template-hash":"ccb96694c
        "},
        "host":"k3d-mycluster-server-0",
        "pod_ip":"10.42.0.2",
        "container_name":"coredns",
        "docker_id":"2b47cfafc44227527ebd36f71998e290e2db38db29bff4a3c7355d578fdf16f2",
        "container_hash":"docker.io/rancher/mirrored-coredns-coredns@sha256:82979ddf442c593027a57239ad90616deb874e90c365d1a96ad508c2104bdea5",
        "container_image":"docker.io/rancher/mirrored-coredns-coredns:1.12.0"}
}
Parsing log content (Optional)
Setting option merge_log_on to true makes Kubernetes filter to parselog field extracted by default by CRI parser used in tail plugin. A different field name can be especified with (merge_log_key)
By default it applies a JSON parser to log field. If k8s_logging_parser is set to true, parser name to be used can be specified through Kuberenetes POD annotation (fluentbit.io/parser).
See further details in Fluent-bit kubernetes filter documentation: Processing log value.
Excluding logs from a POD (optional)
If key k8s-logging.exclude key is set to true, logs from a particular POD can be excluded from processing with POD annotation fluentbit.io/exclude
Lua filter
We want to extract the application name processing some of the labels that might contain that information
For doing that lua filter will configured to extract app key from the value of kubernetes label named app or recommended app.kubernetes.io/name
pipelines:
  filters:
    # ...
    - name: lua
      match: kube.*
      call: extract_app_name
      code: |
        function extract_app_name(tag, timestamp, record)
            if record["kubernetes"] ~= nil then
                if record["kubernetes"]["labels"]["app.kubernetes.io/name"] ~= nil then
                    record["app"] = record["kubernetes"]["labels"]["app.kubernetes.io/name"]
                end
                if record["kubernetes"]["labels"]["app"] ~= nil then
                    record["app"] = record["kubernetes"]["labels"]["app"]
                end
            end
            return 1, timestamp, record
        end
Note:
Alternatively, lua script code can be mounted as configMap, providing it within helm chart luaScripts value
luaScripts:
    parse_kubernetes_metadata.lua: |
      function extract_app_name(tag, timestamp, record)
          if record["kubernetes"] ~= nil then
            if record["kubernetes"]["labels"]["app.kubernetes.io/name"] ~= nil then
                record["app"] = record["kubernetes"]["labels"]["app.kubernetes.io/name"]
            end
            if record["kubernetes"]["labels"]["app"] ~= nil then
                record["app"] = record["kubernetes"]["labels"]["app"]
            end
          end
          return 1, timestamp, record
      end
And the filter can be configured as:
pipelines:
  filters:
    # ...
    - name: lua
      match: kube.*
      call: extract_app_name
      script: parse_kubernetes_metadata
Output sample record from this filter in json format:
{
    "date":1750248166.869028,
    "time":"2025-06-18T12:02:46.869027667Z",
    "stream":"stdout",
    "_p":"F",
    "log":"[WARNING] No files matching import glob pattern: /etc/coredns/custom/*.override",
    "filename":"/var/log/containers/coredns-ccb96694c-xhjtm_kube-system_coredns-2b47cfafc44227527ebd36f71998e290e2db38db29bff4a3c7355d578fdf16f2.log",
    "kubernetes":{
        "pod_name":"coredns-ccb96694c-xhjtm",
        "namespace_name":"kube-system",
        "pod_id":"1395c788-6f97-405b-b90b-e0db1deb3beb",
        "labels":{
            "k8s-app":"kube-dns",
            "app.kubernetes.io/name":"coredns",
            "pod-template-hash":"ccb96694c
        "},
        "host":"k3d-mycluster-server-0",
        "pod_ip":"10.42.0.2",
        "container_name":"coredns",
        "docker_id":"2b47cfafc44227527ebd36f71998e290e2db38db29bff4a3c7355d578fdf16f2",
        "container_hash":"docker.io/rancher/mirrored-coredns-coredns@sha256:82979ddf442c593027a57239ad90616deb874e90c365d1a96ad508c2104bdea5",
        "container_image":"docker.io/rancher/mirrored-coredns-coredns:1.12.0"
    },
    "app": "coredns"

}
Nest Filter
Since we want to extract fields from kubernetes metadata and modify filter does not work properly renaming keys within maps, nest filter is used to take a map by key and lift its records up, so all metadata keys generated by kubernetes filter are transformed into kubernetes_ keys:
This can be done with the filter:
pipelines:
  filters:
      # ...
    - name: nest
      match: kube.*
      operation: lift
      nested_under: kubernetes
      add_prefix: kubernetes_
Output sample in json format of this filter is:
{
    "date":1750248166.869028,
    "time":"2025-06-18T12:02:46.869027667Z",
    "stream":"stdout",
    "_p":"F",
    "log":"[WARNING] No files matching import glob pattern: /etc/coredns/custom/*.override",
    "filename":"/var/log/containers/coredns-ccb96694c-xhjtm_kube-system_coredns-2b47cfafc44227527ebd36f71998e290e2db38db29bff4a3c7355d578fdf16f2.log",
    "kubernetes_pod_name":"coredns-ccb96694c-xhjtm",
    "kubenertes_namespace_name":"kube-system",
    "kubernetes_pod_id":"1395c788-6f97-405b-b90b-e0db1deb3beb",
    "kubernetes_labels":{
        "k8s-app":"kube-dns",
        "app.kubernetes.io/name":"coredns",
        "pod-template-hash":"ccb96694c"
    },
    "kubernetes_host":"k3d-mycluster-server-0",
    "kubernetes_pod_ip":"10.42.0.2",
    "kubernetes_container_name":"coredns",
    "kubernetes_docker_id":"2b47cfafc44227527ebd36f71998e290e2db38db29bff4a3c7355d578fdf16f2",
    "kubernetes_container_hash":"docker.io/rancher/mirrored-coredns-coredns@sha256:82979ddf442c593027a57239ad90616deb874e90c365d1a96ad508c2104bdea5",
    "kubernetes_container_image":"docker.io/rancher/mirrored-coredns-coredns:1.12.0"
}
Modify filter
modify filter is used to rename only kubernetes keys that we want to keep and remove the rest. Also _p key is removed since it is not adding any value (multiparser cri is processing partial messages.)
pipelines:
  filters:
    # ...
    - name: modify
      match: kube.*
      rename: kubernetes_pod_name pod
      rename: kubernetes_namespace_name namespace
      rename: kubernetes_container_name container
      rename: kubernetes_host host
      remove_wildcard: kubernetes_
      remove: _p
Output sample in json format of this filter is:
{
    "date":1750248166.869028,
    "time":"2025-06-18T12:02:46.869027667Z",
    "stream":"stdout",
    "log":"[WARNING] No files matching import glob pattern: /etc/coredns/custom/*.override",
    "filename":"/var/log/containers/coredns-ccb96694c-xhjtm_kube-system_coredns-2b47cfafc44227527ebd36f71998e290e2db38db29bff4a3c7355d578fdf16f2.log",
    "pod":"coredns-ccb96694c-xhjtm",
    "namespace":"kube-system",
    "host":"k3d-mycluster-server-0",
    "container":"coredns",
    "app": "coredns"

}
Outputs
ElasticSearch Plugin
Note: This plugin has to be added to the configuration in case of deploying a forwarder-only logging architecture
pipelines:
  # ...
  # Output
  outputs:
    - name: es
      alias: output.es
      match: '*'
      host: ${FLUENT_ELASTICSEARCH_HOST}
      port: ${FLUENT_ELASTICSEARCH_PORT}
      http_user: ${FLUENT_ELASTICSEARCH_USER}
      http_passwd: ${FLUENT_ELASTICSEARCH_PASSWORD}
      # Indexes are created following logstash format <logstash_prefix>-<YYYY-mm-dd>
      logstash_format: true
      logstash_prefix: fluentbit
      # Mandatory for ES 8.x
      suppress_type_name: true
      # Disable TLS
      tls: false
      # Disable limit in retries
      retry_limit: false
-
hostandportindicates ElasticSearch EndpointIf ElasticSearch has been installed following instructions in PiCluster - ElasticSearch, the following values need to be provided as environment variables
${FLUENT_ELASTIC_HOST}=efk-es-http.elastic${FLUENT_ELASTIC_PORT}= 9200
-
http_userandhttp_password: ElasticSearch user/password.If ElasticSearch have been installed following instructions in PiCluster - ElasticSearch, the following values need to be provided as environment variables
${FLUENT_ELASTICSEARCH_USER}=fluentd${FLUENT_ELASTICSEARCH_PASSWORD}=<fluentd-password>
Note: ElasticSearch user
fluentdcan be used for fluent-bit installation -
tlsis disabled. ElasticSearch is configured to run behind NGINX proxy and HTTPS is disabled -
logstash_formatandlogstash_prefix: Enabling logstash format so ES indeces are created with the following namefluentbit-<YYYY-MM-dd>and a new index is created per day. -
suppres_type_nameto true, sotypeparameter is ignored. Elasticsearch 8.0.0 or higher no longer supports mapping types -
retry_limitto false, so number of retries are not limited.
Environment variables need to be specified in Helm chart values.yaml file.
# Environment variables used by Fluent Config files
# ELASTICSEARCH PLUGIN variables
env:
  - name: FLUENT_ELASTICSEARCH_HOST
    value: "efk-es-http.elastic"
  # Default elasticsearch default port
  - name: FLUENT_ELASTICSEARCH_PORT
    value: "9200"
  # Elasticsearch user
  - name: FLUENT_ELASTICSEARCH_USER
    valueFrom:
      secretKeyRef:
        name: fluent-bit-env-secret
        key: FLUENT_ELASTICSEARCH_USER
  # Elastic operator stores elastic user password in a secret
  - name: FLUENT_ELASTICSEARCH_PASSWORD
    valueFrom:
      secretKeyRef:
        name: fluent-bit-env-secret
        key: FLUENT_ELASTICSEARCH_PASSWORD
Where elasticsearch user and password are stored in a Kubernetes Secret (user/password)
Important:
Fluent-bit ElasticSearch plugin does not support the remote management of Elastic ILM policies and Indexes templates. Fluentd ElasticSearch output-plugin does support this functionality.
This is one the main reasons why Fluentd has been deployed in PI cluster aggregation layer instead of deploying an architecture based only in Fluent-bit.
Loki Plugin
Note: This plugin has to be added to the configuration in case of deploying a forwarder-only logging architecture
pipelines:
  # ...
  # Output
  outputs:
    - name: loki
      alias: output.loki
      match: '*'
      host: ${FLUENT_LOKI_HOST}
      port: ${FLUENT_LOKI_PORT}
      labels: job=fluentbit
      label_keys: $app, $container, $pod, $namespace, $host, $filename
      line_format: json
      # Disable TLS
      tls: false
        # Disable limit in retries
      retry_limit: false
-
hostandportindicates Loki EndpointIf Loki has been installed following instructions in PiCluster - Loki, the following values need to be provided as environment variables
${FLUENT_LOKI_HOST}=loki-headless.loki${FLUENT_LOKI_PORT}= 3100
-
labelsandlabels_keysdefine the labels Loki can use to index the logs. Main keys from the record are used to index the logs. -
tlsis disabled. Loki endpoint is not running behind any HTTPS proxy. -
retry_limitto false, so number of retries are not limited.
Environment variables need to be specified in Helm chart values.yaml file.
# Environment variables used by Fluent Config files
# LOKI PLUGIN variables
env:
  # Loki Output plugin config
  #
  - name: FLUENT_LOKI_HOST
    value: "loki-headless.loki"
  # Default elasticsearch default port
  - name: FLUENT_LOKI_PORT
    value: "3100"
Forward Plugin
Note: This plugin has to be added to the configuration in case of deploying a forwarder-aggregator logging architecture
Forward is the protocol used by Fluentd to route messages between peers. The forward output plugin provides interoperability between Fluent Bit and Fluentd Fluent-bit forward output plugin is used so logs messages can be forwarded to fluentd running as log aggregator/distributor.
This plugin offers two different transports and modes:
- Forward (TCP): It uses a plain TCP connection.
- Secure Forward (TLS): when TLS is enabled, the plugin switch to Secure Forward mode.
TLS is configured in fluentd end, since its endpoint will be exposed so logs comming from external nodes (homelab router, external nodes) can be collected.
With the following configuration all fluent-bit logs will be forwarded to fluentd.
pipeline:
...
  outputs:
    - name: forward
      alias: output.aggregator
      match: '*'
      host: ${FLUENT_AGGREGATOR_HOST}
      port: ${FLUENT_AGGREGATOR_PORT}
      self_hostname: ${FLUENT_SELFHOSTNAME}
      shared_key: ${FLUENT_AGGREGATOR_SHARED_KEY}
      tls: true
      tls.verify: false
-
hostandportindicates fluentd’s endpoint exposed by Forwarderd input plugin (fluend service IP and port)If Fluentd has been installed following instructions in PiCluster - Fluentd, the following values need to be provided as environment variables:
${FLUENT_AGGREGATOR_HOST}=fluentd. (fluentd and fluentbit running in same namespace)${FLUENT_AGGREGATOR_PORT}= 2240
-
shared_key: Forward protocol authentication is based on using shared secret known by both ends of the communication -
tlsset to true to enable TLS communication andtls.verifyset to false so self-signed certificates are not verified -
self_hostname: FQDN assigned to the fluent-bit node
These environment variables need to be specified in Helm chart values.yaml file.
# Environment variables used by Fluent Config files
# FORWARDER PLUGIN variables
env:
  # Fluentd deployment service
  - name: FLUENT_AGGREGATOR_HOST
    value: fluentd
  # Default fluentd forward port
  - name: FLUENT_AGGREGATOR_PORT
    value: "24224"
  - name: FLUENT_AGGREGATOR_SHARED_KEY
    valueFrom:
      secretKeyRef:
        name: fluent-bit-env-secret
        key: FLUENT_AGGREGATOR_SHARED_KEY
    # Setting nodeName as environment variable
  - name: FLUENT_SELFHOSTNAME
    valueFrom:
      fieldRef:
        fieldPath: spec.nodeName
Where fluent shared key is stored in a Kubernetes Secret
Replacing Filters by new Processors
New Fluent-bit processors, added in Fluent-bit 3.0, can be also used instead of the filters, so performance can be improved since they are running in same thread as input/output plugins.
# Service configuration
service:
  daemon: false
  flush: 1
  log_level: info
  http_server: true
  http_listen: 0.0.0.0
  http_port: 2020
  health_check: true
  hot_reload: true
  storage.path: /var/log/fluentbit/storage
  storage.sync: full
  storage.checksum: true
  storage.backlog.mem_limit: 5M
  storage.metrics: true
parsers:
  - name: syslog-rfc3164-nopri
    format: regex
    regex: '/^(?<time>[^ ]* {1,2}[^ ]* [^ ]*) (?<host>[^ ]*) (?<ident>[a-zA-Z0-9_\/\.\-]*)(?:\[(?<pid>[0-9]+)\])?(?:[^\:]*\:)? *(?<log>.*)$/'
    time_key: time
    time_format: '%b %d %H:%M:%S'
    time_keep: false
pipeline:
  inputs:
    - name: tail
      alias: input.kube
      path: /var/log/containers/*.log
      path_key: filename
      multiline.parser: docker, cri
      tag: kube.*
      db: /var/log/fluentbit/flb_kube.db
      storage.type: filesystem
      skip_long_lines: true
      processors:
        logs:
          - name: multiline
            multiline.key_content: log
            multiline.parser: go, java, python
          - name: kubernetes
            buffer_size: 512k
            kube_tag_prefix: kube.var.log.containers.
            merge_log: false
            k8s-logging.parser: true
            k8s-logging.exclude: true
            labels: true
            annotations: false
          - name: lua
            call: extract_app_name
            code: |
              function extract_app_name(tag, timestamp, record)
                  if record["kubernetes"] ~= nil then
                      if record["kubernetes"]["labels"]["app.kubernetes.io/name"] ~= nil then
                          record["app"] = record["kubernetes"]["labels"]["app.kubernetes.io/name"]
                      end
                      if record["kubernetes"]["labels"]["app"] ~= nil then
                          record["app"] = record["kubernetes"]["labels"]["app"]
                      end
                  end
                  return 1, timestamp, record
              end
          - name: nest
            operation: lift
            nested_under: kubernetes
            add_prefix: kubernetes_
          - name: modify
            rename: kubernetes_pod_name pod
            rename: kubernetes_namespace_name namespace
            rename: kubernetes_container_name container
            rename: kubernetes_host host
            remove_wildcard: kubernetes_
            remove: _p
    - name: tail
      alias: input.host
      path: /var/log/auth.log, /var/log/syslog
      path_key: filename
      parser: syslog-rfc3164-nopri
      tag: host.*
      db: /var/log/fluentbit/flb_host.db
      storage.type: filesystem
  outputs:
    - name: forward
      alias: output.aggregator
      match: '*'
      host: ${FLUENT_AGGREGATOR_HOST}
      port: ${FLUENT_AGGREGATOR_PORT}
      self_hostname: ${FLUENT_SELFHOSTNAME}
      shared_key: ${FLUENT_AGGREGATOR_SHARED_KEY}
      tls: true
      tls.verify: false
Observability
Metrics
Prometheus Integration
Fluent-bit generates expose metrics that are Prometheus compliant at endpoint /api/v2/metrics/prometheus. List of available metrics can be found in Fluent-bit documentation: Fluent-bit: Monitoring V2 Metrics
Note: About v1 and v2 metric endpoints
Fluent-bit has two different endpoints /api/v1/metrics/prometheus and /api/v2/metrics/prometheus providing Prometheus-compliant metrics
Storage/buffering metrics (available in JSON format through endpoint /api/v1/storage) are not available with Prometheus format using v1. Those metrics are available using v2. That’s why v2 endpoint should be used.
To enable it, Fluent-bit HTTP server need to be configured
service:
  http_server: true
  http_listen: 0.0.0.0
  http_port: 2020
Note: About configuring aliases
By default, configured plugins on runtime get an internal name in the format_plugin_name.ID_. For monitoring purposes, this can be confusing if many plugins of the same type were configured. To make a distinction each configured input or output section can get an alias that will be used as the parent name for the metric.
Integration with Kube-prom-stack
Providing serviceMonitor.enabled: true to the helm chart values.yaml file, corresponding Prometheus Operator’s resource, ServiceMonitor, so Kube-Prometheus-Stack can automatically start scraping metrics from v2 endpoint.
Grafana Dashboards
If Grafana’s dynamic provisioning of dashboard is configured, Fluent-bit dashboard is automatically deployed by Helm chart when providing the following values:
# Enable Grafana dashboard
dashboards:
  enabled: true
  labelKey: grafana_dashboard
  labelValue: 1
  annotations:
  grafana_folder: "Logging"
Helm chart will deploy a dahsboard in a kubernetes ConfigMap that Grafana can dynamically load and add into “Loggin” folder.